Owning a Home
How Much Is the Average Water and Sewer Bill?
Quick answer
The average water and sewer bill for a U.S. homeowner who gets one is about $63 a month, or $761 a year, in the Census Bureau's 2024 American Community Survey. The typical bill is lower, $50 a month, and the 2023 American Housing Survey puts it at $60. State averages run from $493 a year in Mississippi to $1,112 in Hawaii.
On this page
- What is the average water and sewer bill?
- How much do homeowners pay per month?
- How much is the water and sewer bill in each state?
- Why do water bills differ so much by region?
- Does household size or type of home change the bill?
- How much do septic tanks and wells change the bill?
- How much water does a household use, and what does it cost per gallon?
- Are water and sewer bills going up?
- How does the water bill compare with other home bills?
- How can you lower a water and sewer bill?
- How was this calculated?
- FAQ
- Sources
Water and sewer is the quietest bill of owning a home. It comes monthly, every two months or every quarter, depending on the utility, and water and sewer are often billed together. Most people only notice it when it jumps. This guide uses two Census Bureau surveys to show what homeowners actually pay, then breaks the number down by state, region, household size, type of home and sewage system.
One thing shapes every figure below: not every homeowner gets a water bill. In the 2024 American Community Survey (ACS), 82% of owner households reported a cost for water and sewer, 14% reported no charge and 3% had it included in a condo or similar fee. The averages here are for the owners who do get a bill. I wrote about the rest of the monthly bills in my guides to electric bills and natural gas bills.
What is the average water and sewer bill?
For homeowners who get a separate bill, about $761 a year, or $63 a month, in the 2024 ACS. The median, the bill right in the middle of owners who get one, is $600 a year, or $50 a month. The American Housing Survey (AHS) asks the question differently, as a monthly amount, and for 2023 it gives a median of $60 and an average of $74 a month. The two surveys are about $10 apart, so I would read the answer as a typical bill of $50 to $60 and an average of $63 to $74 a month.
| Survey and group | Homes | Median a month | Average a month | Average a year |
|---|---|---|---|---|
| Homeowners, ACS 2024 | 71.2 million | $50 | $63 | $761 |
| Homeowners, AHS 2023 | 52.3 million | $60 | $74 | $887 |
| Renters who pay, ACS 2024 | 19.9 million | $33 | $48 | $579 |
| Renters who pay, AHS 2023 | 13.1 million | $50 | $62 | $744 |
What homeowners pay for water and sewer when they get a separate bill, from two Census Bureau surveys. Renters who pay are shown for comparison. Monthly figures are the yearly bill divided by 12 in the ACS, and the reported monthly cost in the AHS.
The average sits above the median because a minority pays much more. One owner in four pays $150 a year or less ($13 a month), while one in ten pays $1,600 or more ($133 a month). Your own bill depends on your utility's rates and on how much water you use, so a national figure is only a yardstick.
How much do homeowners pay per month?
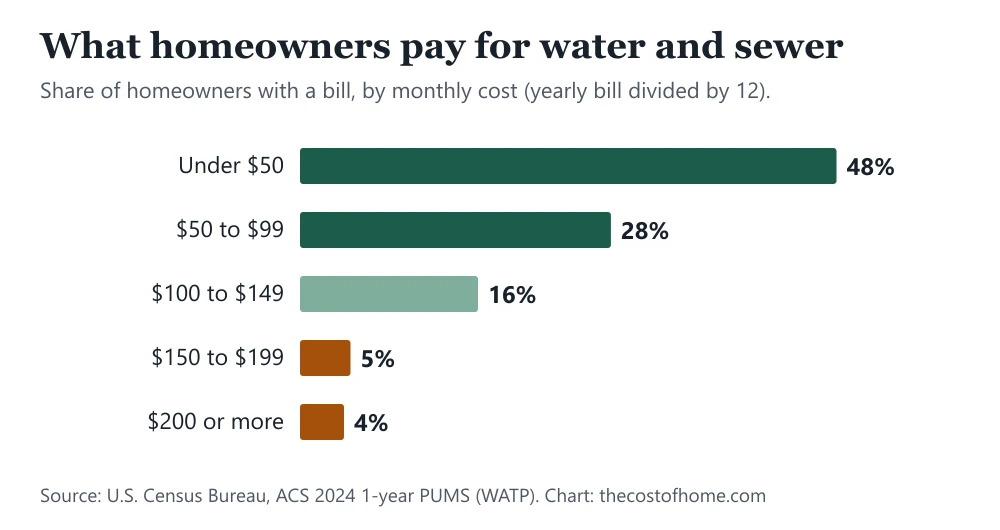
Most pay under $100. Among owners with a bill, 48% pay less than $50 a month and 28% pay $50 to $99. Another 16% pay $100 to $149, and 8% pay $150 or more.
Who is left out of these numbers? 14% of owner households in the ACS report no charge for water. The AHS counts 12.1 million owner households on an individual well, about 14% of owners, close to the same share. Another 3% of owners have water included in a condo or similar fee.
How much is the water and sewer bill in each state?
From $493 a year in Mississippi to $1,112 in Hawaii, more than twice as much. The table shows all 50 states and D.C. Three states average above $1,000 a year: Hawaii ($1,112), Washington ($1,093), California ($1,047). Oregon ($985), D.C. ($947) and Alaska ($931) come next. Just 14 of the 51 places average more than the U.S. figure of $761, which counts every household, so large states such as California, Texas and Pennsylvania pull it up.
| State | Average a year | Average a month | Margin of error | Owners paying |
|---|---|---|---|---|
| U.S. average | $761 | $63 | ±$3 | 82% |
| Alabama | $565 | $47 | ±$18 | 95% |
| Alaska | $931 | $78 | ±$167 | 56% |
| Arizona | $774 | $64 | ±$9 | 92% |
| Arkansas | $573 | $48 | ±$14 | 92% |
| California | $1,047 | $87 | ±$8 | 90% |
| Colorado | $809 | $67 | ±$12 | 85% |
| Connecticut | $684 | $57 | ±$14 | 68% |
| Delaware | $672 | $56 | ±$26 | 78% |
| District of Columbia | $947 | $79 | ±$48 | 71% |
| Florida | $743 | $62 | ±$7 | 79% |
| Georgia | $571 | $48 | ±$11 | 84% |
| Hawaii | $1,112 | $93 | ±$41 | 75% |
| Idaho | $750 | $63 | ±$19 | 76% |
| Illinois | $749 | $62 | ±$9 | 84% |
| Indiana | $673 | $56 | ±$10 | 77% |
| Iowa | $726 | $61 | ±$15 | 86% |
| Kansas | $703 | $59 | ±$15 | 92% |
| Kentucky | $638 | $53 | ±$11 | 93% |
| Louisiana | $585 | $49 | ±$12 | 92% |
| Maine | $662 | $55 | ±$34 | 41% |
| Maryland | $732 | $61 | ±$12 | 76% |
| Massachusetts | $831 | $69 | ±$10 | 82% |
| Michigan | $729 | $61 | ±$18 | 68% |
| Minnesota | $677 | $56 | ±$12 | 72% |
| Mississippi | $493 | $41 | ±$12 | 91% |
| Missouri | $705 | $59 | ±$10 | 83% |
| Montana | $703 | $59 | ±$28 | 58% |
| Nebraska | $582 | $49 | ±$20 | 84% |
| Nevada | $783 | $65 | ±$20 | 90% |
| New Hampshire | $655 | $55 | ±$27 | 48% |
| New Jersey | $812 | $68 | ±$10 | 86% |
| New Mexico | $655 | $55 | ±$18 | 84% |
| New York | $658 | $55 | ±$13 | 72% |
| North Carolina | $614 | $51 | ±$11 | 75% |
| North Dakota | $647 | $54 | ±$27 | 91% |
| Ohio | $705 | $59 | ±$7 | 82% |
| Oklahoma | $715 | $60 | ±$14 | 87% |
| Oregon | $985 | $82 | ±$15 | 81% |
| Pennsylvania | $827 | $69 | ±$8 | 79% |
| Rhode Island | $723 | $60 | ±$32 | 82% |
| South Carolina | $614 | $51 | ±$10 | 83% |
| South Dakota | $663 | $55 | ±$26 | 90% |
| Tennessee | $545 | $45 | ±$21 | 90% |
| Texas | $828 | $69 | ±$17 | 92% |
| Utah | $731 | $61 | ±$16 | 93% |
| Vermont | $706 | $59 | ±$39 | 43% |
| Virginia | $784 | $65 | ±$11 | 73% |
| Washington | $1,093 | $91 | ±$14 | 82% |
| West Virginia | $749 | $62 | ±$18 | 84% |
| Wisconsin | $733 | $61 | ±$13 | 67% |
| Wyoming | $755 | $63 | ±$50 | 80% |
Water and sewer bill of owner-occupied homes that get a bill, by state, 2024. The average is the mean yearly bill; the margin is the 90% margin of error on that average. "Owners paying" is the share of all owner households in the state that report a cost; the rest report no charge or a fee included in a condo or similar fee. Source: U.S. Census Bureau, ACS 2024 1-year PUMS.
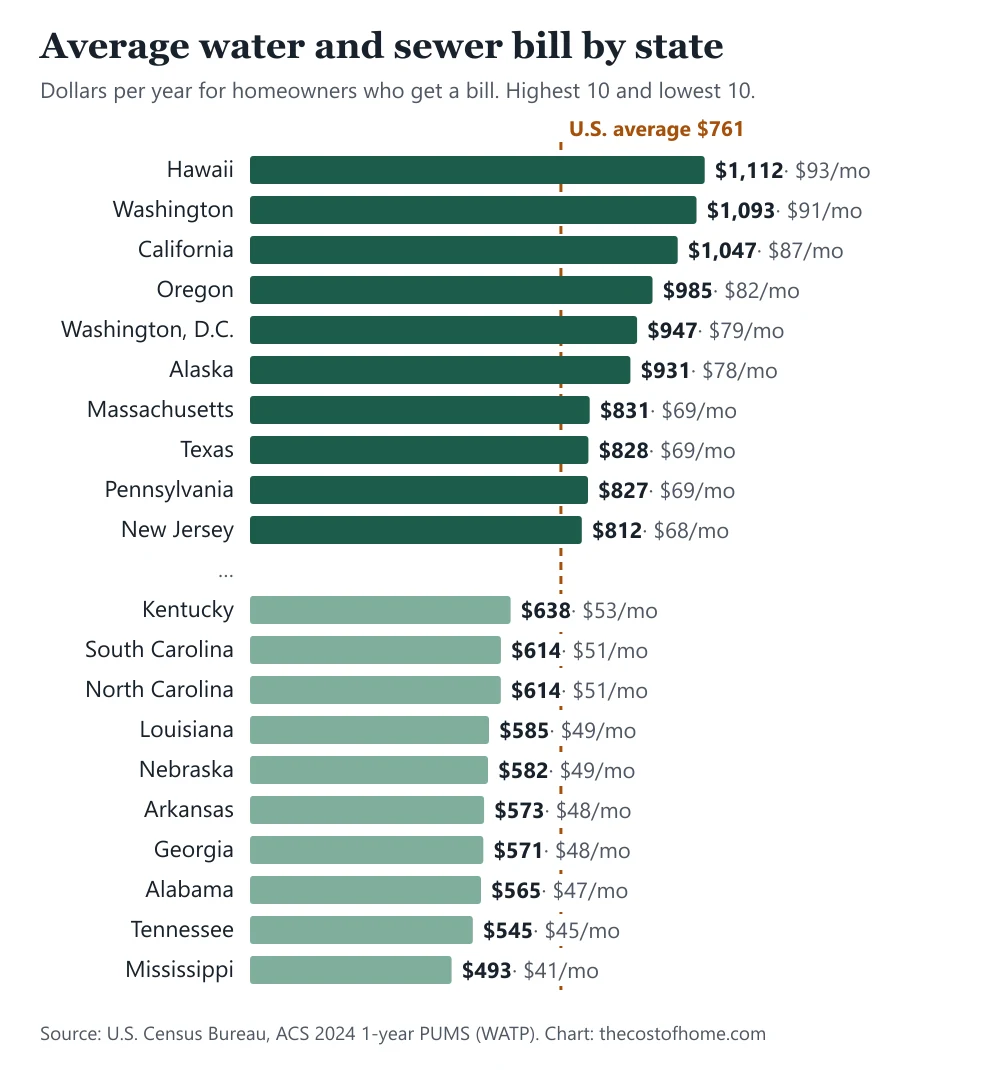
The lowest averages are in Mississippi ($493), Tennessee ($545) and Alabama ($565). Texas ($828) sits well above the national average, and 92% of its owners get a bill. New York is a reminder that the average hides a lot: its average is $658, but the typical owner with a bill pays $450.
Check the last column before comparing states. In Maine only 41% of owners report a water bill, and in Vermont (43%), New Hampshire (48%) and Alaska (56%) the share is under 60%. Where wells and private systems are common, the average describes mainly the owners on a public system. The margin of error on the average is $30 or less in 44 of the 51 places. The widest are Alaska (±$167), Wyoming (±$50) and D.C. (±$48), so treat small-state differences with care.
Why do water bills differ so much by region?
The Pacific division, which holds four of the five highest-averaging places, averages $1,049 a year. The East South Central division of Alabama, Kentucky, Mississippi and Tennessee averages $564, so a Pacific owner pays about 86% more.
| Census division | Average a year | Average a month | Median a year |
|---|---|---|---|
| Pacific | $1,049 | $87 | $900 |
| West South Central | $766 | $64 | $600 |
| Mountain | $763 | $64 | $650 |
| New England | $760 | $63 | $600 |
| Middle Atlantic | $758 | $63 | $600 |
| East North Central | $721 | $60 | $600 |
| South Atlantic | $688 | $57 | $540 |
| West North Central | $686 | $57 | $600 |
| East South Central | $564 | $47 | $420 |
Water and sewer bill of owner-occupied homes that get a bill, by Census division, 2024. Source: U.S. Census Bureau, ACS 2024 1-year PUMS.
The survey records what people pay, not why. Two things I can point to from sources I read. First, how much water a home uses: the EPA says outdoor use is about 30 percent of household use nationally, and much higher in the arid West, which has some of the highest per-person residential water use because of landscape irrigation. Second, how utilities charge: a 2023 rate survey of Georgia utilities by the University of Georgia and the University of North Carolina's Environmental Finance Center found that almost all use a base charge plus a charge by volume, and that 52% of residential water rate structures raise the price per gallon as the customer uses more. Utilities in other states set their own rate structures, so your bill depends on your utility, not your state.
Does household size or type of home change the bill?
Yes, but modestly. Among owners of detached houses with a bill, a one-person household pays $635 a year on average and a household of five or more pays $950. Each extra person adds roughly $60 to $110 a year, so a household of five or more pays about 49% more than a person living alone.
| Household size | Average a year | Average a month | Median a year |
|---|---|---|---|
| 1 person | $635 | $53 | $500 |
| 2 people | $746 | $62 | $600 |
| 3 people | $812 | $68 | $670 |
| 4 people | $870 | $73 | $720 |
| 5 or more people | $950 | $79 | $800 |
Yearly water and sewer bill of owners of detached one-family houses that get a bill, by number of people in the household, 2024. Source: U.S. Census Bureau, ACS 2024 1-year PUMS.
The type of home matters through who pays the bill. Detached houses average $776 a year, and 85% of those owners get a bill. Owners of homes in buildings of five or more units average $614, but only 29% of them pay a separate bill, and the rest report water in the building's fee or no charge. Small buildings of two to four units average $958, the highest of the five types, with a margin of error of ±$18.
| Type of home | Owners paying | Average a year | Average a month | Median a year |
|---|---|---|---|---|
| Detached house | 85% | $776 | $65 | $600 |
| Townhouse (attached) | 84% | $687 | $57 | $560 |
| 2 to 4 apartments | 77% | $958 | $80 | $720 |
| 5+ apartments (condo) | 29% | $614 | $51 | $400 |
| Mobile home | 70% | $552 | $46 | $420 |
Yearly water and sewer bill of homeowners who get a bill, by type of home, 2024. "Owners paying" is the share of owner households in that type of home that report a cost. Source: U.S. Census Bureau, ACS 2024 1-year PUMS.
How much do septic tanks and wells change the bill?
Quite a lot. In the AHS, homeowners on a public sewer who pay a separate bill have a typical cost of $70 a month and an average of $79. Owners with a septic tank or cesspool who still pay a water bill have a typical $40 and an average of $52, about $30 a month less at the median. The AHS counts 21.6 million owner households on septic, roughly 25% of owners.
| Homeowners with a bill | Homes | Median a month | Average a month |
|---|---|---|---|
| All homeowners with a bill | 52.3 million | $60 | $74 |
| Public sewer | 42.5 million | $70 | $79 |
| Septic tank or cesspool | 9.6 million | $40 | $52 |
| Individual well | 1.3 million | $40 | $55 |
Monthly cost of water and sewer paid separately by homeowners, by type of sewage system and water source, 2023. The rows overlap: a home on a well can also be on septic. Source: U.S. Census Bureau and HUD, American Housing Survey 2023.
The savings are not free. A septic system has its own upkeep, which never shows up on a utility bill, and I did not price it here. The 1.3 million well owners in the table are the minority of well users who still report a separate water cost. For the municipal side, my guide to sewer line camera inspections covers what a problem in the line from the house to the sewer can cost.
How much water does a household use, and what does it cost per gallon?
The EPA says the average American family uses more than 300 gallons of water a day at home, about 70 percent of it indoors. That is roughly 9,100 gallons a month. Set the average bill of $63 against that and the cost works out to about $7 per 1,000 gallons for water and sewer together. That is my arithmetic, not a utility rate: it mixes homes that use far more or less than 300 gallons, in thousands of systems with different prices. It is a yardstick to hold your own bill against, nothing more.

Are water and sewer bills going up?
Yes, faster than prices in general. The Bureau of Labor Statistics tracks what consumers pay for water and sewerage service in the CPI. In September 2026 that index was 4.7% higher than a year earlier, against 3.7% for all items. Over five years the gap is 26.2% against 22.8%.
| Since | Water and sewer | All items |
|---|---|---|
| September 2025 (one year) | +4.7% | +3.7% |
| September 2021 (five years) | +26.2% | +22.8% |
| September 2017 (nine years) | +43.1% | +36.5% |
Change in the consumer price index for water and sewerage maintenance and for all items, from September of each year to September 2026. Source: U.S. Bureau of Labor Statistics, CPI-U, U.S. city average, not seasonally adjusted.
On the average bill of $761 a year, a 4.7% rise is about $36 a year. The index measures rates, not what any household pays, because use changes the bill too. I would treat it as the direction of travel and leave a little room for it in the budget.
How does the water bill compare with other home bills?
It is the smallest of the regular utility bills. At $63 a month, water and sewer costs about 41% of the average electric bill and about 75% of the average gas bill, and about 23% of the median property tax payment. The sources for each figure are in my guides to electric, gas and property tax.
| Bill | Per month | What it is |
|---|---|---|
| Electricity | $156 | Average home bill, 12 months to July 2026 (EIA) |
| Natural gas | $84 | Average bill of homes with gas service, 2025 (EIA) |
| Water and sewer | $63 | Average of homeowners who get a bill, 2024 (ACS) |
| Property tax | $279 | Median tax paid by owner-occupied homes, 2025 (ACS) |
Water and sewer next to the other regular bills of owning a home. The figures come from different years and sources, so use them for scale, not for an exact total.
My read: the water bill is small and steady, so a sudden jump is a signal worth checking, starting with leaks.
How can you lower a water and sewer bill?
Start with leaks. The EPA says the average household's leaks waste more than 9,300 gallons of water a year, and that nine percent of homes have leaks of 50 gallons or more per day. It also says fixing easily corrected household leaks can save about 10 percent on a water bill. At the average of $761 a year, 10 percent is about $76.
The EPA's own checks cost almost nothing. Look at your usage in a cold month such as January or February, when outdoor watering is off: for a family of four, more than 12,000 gallons in a month suggests a serious leak. To test a toilet, put a few drops of food coloring in the tank, wait 10 minutes without flushing, and see whether color shows up in the bowl. The EPA notes that an old flapper can leak thousands of gallons a year and should be checked periodically. It also suggests reading the usage on your bill, not just the amount due, because that number is what you can change.
If the bill is high with no leak, outdoor watering is the next place to look, since the EPA puts it at about 30 percent of household use nationally. For the other home costs that tend to surprise owners, see my guide to home maintenance costs per year and the rest of Owning a Home.
How was this calculated?
The state, region, household and home-type figures come from the Census Bureau's American Community Survey 2024 1-year public use microdata (PUMS), housing records. The variable is WATP, the yearly water cost (the survey asks about water and sewer), with WATFP marking households that report a cost, no charge, or a fee included in rent or a condo fee. I kept occupied homes with a reported cost of $3 or more and weighted each by the Census housing-unit weight (WGTP). Owners are households that own with or without a mortgage; renters rent. The Census rounds and top-codes WATP at $9,999, and no owner with a bill hit that cap, so the average is not cut off. The 90% margins of error use the Census's 80 replicate weights.
Because WATP is rounded, many state medians land on the same round numbers, so I use the averages for the state comparison and keep the medians for the national figures. The ACS is for 2024 because the 2025 microdata is not out yet. The AHS figures are from the 2023 national public-use file, variable WATERAMT, the monthly cost of water and sewer paid separately, and match the Census's published verification table (66.2 million households, median $60, average $71). The two surveys do not agree on how many owners pay a separate bill (82% in the ACS, about 60% in the AHS), so compare their dollar amounts, not their household counts.
The price index is the BLS CPI-U for water and sewerage maintenance (series CUUR0000SEHG01) against all items, U.S. city average, not seasonally adjusted, September values read from the BLS public API on November 2, 2026. The electric, gas and property tax lines in the comparison table are from my other guides, linked above. The gallons figure is the EPA's, and the cost per 1,000 gallons is my division of the two. My sources and method are set out in how I research costs.
Frequently asked questions
What is the average water bill per month?
About $63 a month for U.S. homeowners who get a water and sewer bill, or $761 a year, in the Census Bureau's 2024 American Community Survey. The typical bill is lower: $50 a month in that survey and $60 in the 2023 American Housing Survey.
What is the average water and sewer bill for a family of four?
Owners of detached houses with four people in the household and a water bill average $870 a year, about $73 a month, in the ACS 2024. A household of five or more averages $950.
Which state has the highest water bill?
Hawaii, at an average of $1,112 a year ($93 a month) for homeowners with a bill, followed by Washington ($1,093) and California ($1,047). The lowest average is Mississippi's, $493 a year.
Do homes on septic pay a sewer bill?
Not to a utility, since a septic tank is on the property. In the American Housing Survey, owners with a septic tank or cesspool who still pay a separate water bill have a typical cost of $40 a month, against $70 for owners on a public sewer. A septic system has its own upkeep costs, which are not on that bill.
Is water included in rent or a condo fee?
Often. In the ACS 2024, 40% of renter households have water included in the rent and 45% pay it separately. Among owners in buildings of five or more units, only 29% get a separate bill.
How much does water cost per gallon?
The EPA says the average American family uses more than 300 gallons a day. Dividing the $63 average bill by about 9,125 gallons a month gives roughly $7 per 1,000 gallons for water and sewer together. That is a rough national figure, not a utility rate.
Why is my water bill so high?
One common cause is a leak. The EPA says the average household wastes more than 9,300 gallons a year to leaks and that nine percent of homes leak 50 gallons or more per day. A family of four using more than 12,000 gallons in a winter month may have a serious leak. Rates are also rising: the BLS water and sewerage index was up 4.7% in the year to September 2026.
Are water and sewer bills going up?
Yes. The BLS consumer price index for water and sewerage maintenance rose 4.7% from September 2025 to September 2026, against 3.7% for all items, and 26.2% over five years, against 22.8%.
Sources
- U.S. Census Bureau, American Community Survey 2024 1-year Public Use Microdata Sample (PUMS), housing records (csv_hus.zip; variables WATP, WATFP, TEN, NP, BLD, WGTP and replicate weights; accessed November 2, 2026)
- U.S. Census Bureau, ACS 2024 PUMS variable WATP: water cost, yearly, $3 to $9,999 rounded and top-coded, with the code for included in rent or condo fee or no charge (accessed November 2, 2026)
- U.S. Census Bureau, American Community Survey, "Why We Ask: Utilities": questions on the cost of utilities, condominium fees, taxes, insurance and mortgages (accessed November 2, 2026)
- U.S. Census Bureau and HUD, American Housing Survey 2023, national public-use file v1.1, household file (variables WATERAMT, SEWTYPE, WATSOURCE, TENURE; accessed October 30, 2026)
- U.S. Census Bureau, AHS 2023 Table Specifications and PUF Estimates for User Verification: water paid separately, 66.2 million units, median $60 and mean $71 a month (accessed October 30, 2026)
- U.S. Environmental Protection Agency, WaterSense, "How We Use Water": more than 300 gallons a day per family at home, about 70 percent indoors and 30 percent outdoors (accessed November 2, 2026)
- U.S. Environmental Protection Agency, WaterSense, Fix a Leak Week: household leaks, the 12,000-gallon winter check, toilet flapper and dye test (accessed November 2, 2026)
- U.S. Bureau of Labor Statistics, Consumer Price Index for All Urban Consumers, water and sewerage maintenance, U.S. city average, series CUUR0000SEHG01, and all items, series CUUR0000SA0 (September 2017, 2021, 2025 and 2026; read from the public API on November 2, 2026)
- Carl Vinson Institute of Government (University of Georgia) and Environmental Finance Center (University of North Carolina at Chapel Hill), 2023 Georgia Water and Wastewater Rates Survey Report: base charges and volumetric rate structures (accessed November 2, 2026)
- U.S. Energy Information Administration, Form EIA-861M: monthly electricity sales, revenue and customers by state, for the electric bill in the comparison table (see my electric bill guide; accessed October 15, 2026)
- U.S. Energy Information Administration, Natural Gas Prices and consumption: residential, for the gas bill in the comparison table (see my natural gas bill guide; accessed October 17, 2026)
- U.S. Census Bureau, American Community Survey 2025 1-year estimates, Table B25103, median real estate taxes paid, for the property tax in the comparison table (see my property tax guide; accessed October 29, 2026)

Founder and editor, The Cost of Home
I write and check every guide on this site myself, working from public data. The sources behind each number are listed at the end of the article, so you can check them too.