Owning a Home
How Much Does Home Maintenance Cost per Year?
Quick answer
Most homeowners spend far less than the 1% rule says. In the Census Bureau's 2023 American Housing Survey, the typical owner reported $510 of routine upkeep in a normal year, and about $1,040 once repairs and system replacements are added, roughly 0.3% of home value. One owner in ten spends 3% or more, so the rule works better as a savings target than as a forecast.

On this page
- How much does home maintenance cost per year?
- What is the 1% rule, and how much would it set aside?
- What do homeowners actually spend?
- Does an older home cost more to maintain?
- Does a more expensive home cost more to maintain?
- Which repairs take the biggest bites?
- What does the Bureau of Labor Statistics say owners spend?
- How much should you set aside?
- Where do these figures fall short?
- FAQ
- Sources
Ask ten homeowners what upkeep costs and you get ten different answers, because the bill comes in lumps. One year it is a few hundred dollars of paint and plumbing parts. The next it is a new water heater or a roof. The usual advice is to set aside a percentage of the home's value, and the first question is whether that percentage matches what owners actually spend.
To find out, I worked from the public-use file of the 2023 American Housing Survey, which the Census Bureau runs for the Department of Housing and Urban Development. It asks owners what they spend on routine upkeep in a typical year, and what they paid for each major repair or improvement in the last two years. I added the Bureau of Labor Statistics' spending survey as a second check and a published rule of thumb as the yardstick. These are national figures, so treat them as a benchmark and not as a price for your house.
How much does home maintenance cost per year?
It depends on what you count, and the three common ways of counting give very different answers:
- Routine upkeep only. The median owner in the survey reported $510 in a typical year, about $43 a month. The average is $1,354, pulled up by owners with large bills.
- Routine upkeep plus repairs and system replacements. Adding roofs, heating and cooling, plumbing, electrical work, windows and similar jobs, the median is $1,038 a year and the average $3,584.
- Everything, remodels included. With kitchens, bathrooms, flooring and outdoor projects added, the median is $1,950 a year and the average $6,277.
For comparison, 1% of the median U.S. home value of $371,100 is $3,711. The typical owner is well below that, and a smaller group is far above it. The rest of this guide shows who is who.
What is the 1% rule, and how much would it set aside?
The 1% rule says to put aside about 1% of your home's value every year for upkeep. It comes with a range: a Cooperative Extension guide supported by the U.S. Department of Agriculture says most financial experts recommend budgeting 1% to 3% of the home's value for annual repairs and maintenance, with the older the home, the more it needs.
At the median U.S. home value of $371,100 (Census Bureau, American Community Survey 2025), that works out to $3,711 at 1% and $11,133 at 3%, by my arithmetic. The Extension guide notes that unspent money can carry over to the next year, which is the point of treating it as a savings target.
What do homeowners actually spend?
Far less than the rule, for most of them. Using the survey's answers, I counted a repair-and-replacement job as any of: damage repairs, roofing, siding, doors and windows, insulation, interior pipes, plumbing fixtures, electrical work, central air, built-in heating, a septic tank, a water heater, or a dishwasher or disposal. Remodels, additions, flooring, security systems and yard projects stay out of that measure. I added the cost of those jobs over the two years, divided by two, to the owner's routine estimate.
- 72% of owners spend less than 1% of their home's value this way.
- 16% spend 2% or more, and 11% spend 3% or more.
- The median owner spends 0.3% of home value, about a third of the rule.
Counting remodels too, the median owner spends 0.6% of home value, and 61% stay under 1%. The Census Bureau saw the same pattern in the 2021 survey: more than half of owners of older homes spent less than 1% of the home's value a year on improvements and maintenance.
The gap between the median and the average is the whole story. Most years cost little, and a minority of years cost a great deal. Across the country, the Census Bureau says owners spent $827 billion on home improvements between 2021 and 2023, and 59% of owners did at least one project.
Does an older home cost more to maintain?
Less than the advice suggests, except at the newest end. Owners of homes built before 2010 report almost the same median bill, between $1,089 and $1,209 a year with repairs counted. Owners of homes built since 2010 report about half that, $494, and are far less likely to be at 1% of value.
| Home built | Owners (millions) | Routine, median | Routine plus repairs, median | Routine plus repairs, average | Owners at 1% of value or more |
|---|---|---|---|---|---|
| All owners | 77.6 | $510 | $1,038 | $3,584 | 28% |
| Before 1960 | 19.2 | $546 | $1,204 | $3,880 | 32% |
| 1960 to 1979 | 18.3 | $511 | $1,089 | $3,656 | 30% |
| 1980 to 1999 | 20.4 | $525 | $1,209 | $3,804 | 31% |
| 2000 to 2009 | 11.2 | $517 | $1,107 | $3,900 | 27% |
| 2010 or later | 8.5 | $297 | $494 | $1,815 | 11% |
What owners spend each year, by the age of the home. "Routine" is the owner's estimate for a typical year. "Routine plus repairs" adds the cost of repair and replacement jobs from the last two years, divided by two. Source: American Housing Survey 2023, Census Bureau and HUD; my calculation.
Age shows up more in who gets hit by a big bill than in the typical one. The average for homes built before 1960 is $3,880, against $1,815 for homes built since 2010. What seems to matter most is how long you have owned the place. The Census Bureau's 2021 survey found that people who had just bought older homes, built before 1950, spent a median of $3,900 a year on upkeep, against about $1,500 for owners who had been there ten years or more. New owners put a median of 1.5% of the home's value into it each year, against 0.6% for longtime owners.
Does a more expensive home cost more to maintain?
In dollars, yes. As a share of value, no. The median owner of a home worth under $200,000 reports $608 a year, and the median owner of a home worth $750,000 or more reports $2,047. But the second group is spending 0.19% of its home value, against 0.68% for the first.
| Home value | Owners (millions) | Routine, median | Routine plus repairs, median | Median as a share of value | Owners at 1% of value or more |
|---|---|---|---|---|---|
| Under $200,000 | 18.9 | $416 | $608 | 0.68% | 42% |
| $200,000 to $349,999 | 20.6 | $502 | $1,010 | 0.38% | 31% |
| $350,000 to $499,999 | 15.9 | $528 | $1,087 | 0.27% | 23% |
| $500,000 to $749,999 | 11.5 | $876 | $1,466 | 0.24% | 21% |
| $750,000 or more | 10.7 | $1,016 | $2,047 | 0.19% | 15% |
What owners spend each year, by the value of the home, as the owner estimates it. Same measures as the table above. Source: American Housing Survey 2023, Census Bureau and HUD; my calculation.
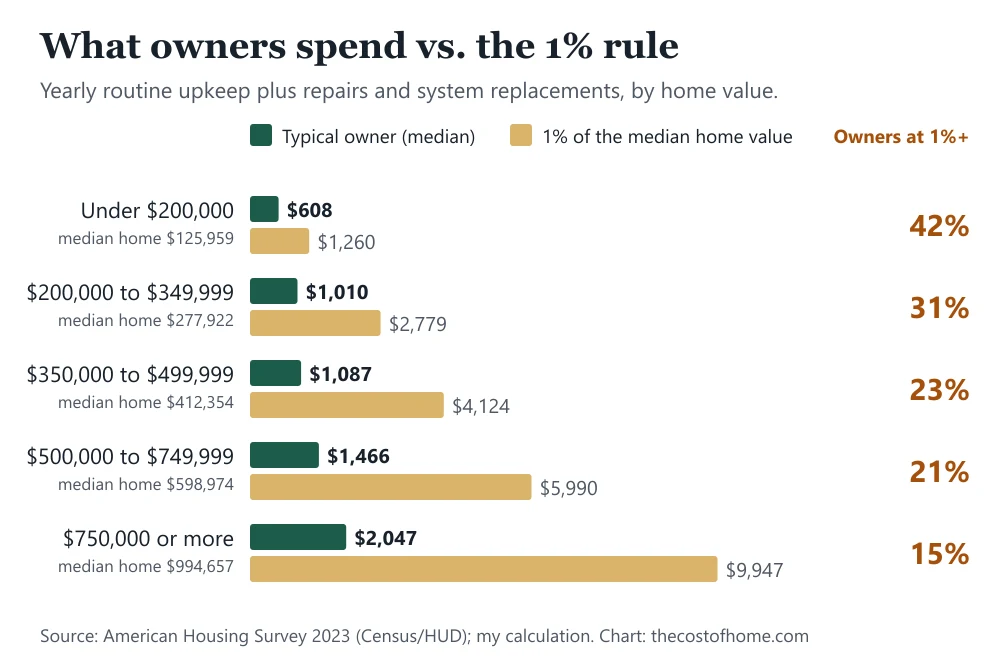
So a flat 1% overshoots the typical owner of a pricey house by a wide margin, and it comes closest to the cheapest homes, where 42% of owners reach it. A dollar-based cushion tied to your own roof, furnace and water heater is a better guide than a percentage of a price that was set by the neighborhood.
Which repairs take the biggest bites?
The lumps come from a short list of jobs. Roofing has the highest median among the common ones, at $10,000, and 0.1% of owners had a roofing job in the two years. Central air conditioning has a median of $6,500, built-in heating equipment $4,700, and 0.1% of owners had one or the other installed or replaced, at a median of $5,500. Doors and windows come in at $2,800, and a water heater at $1,000.
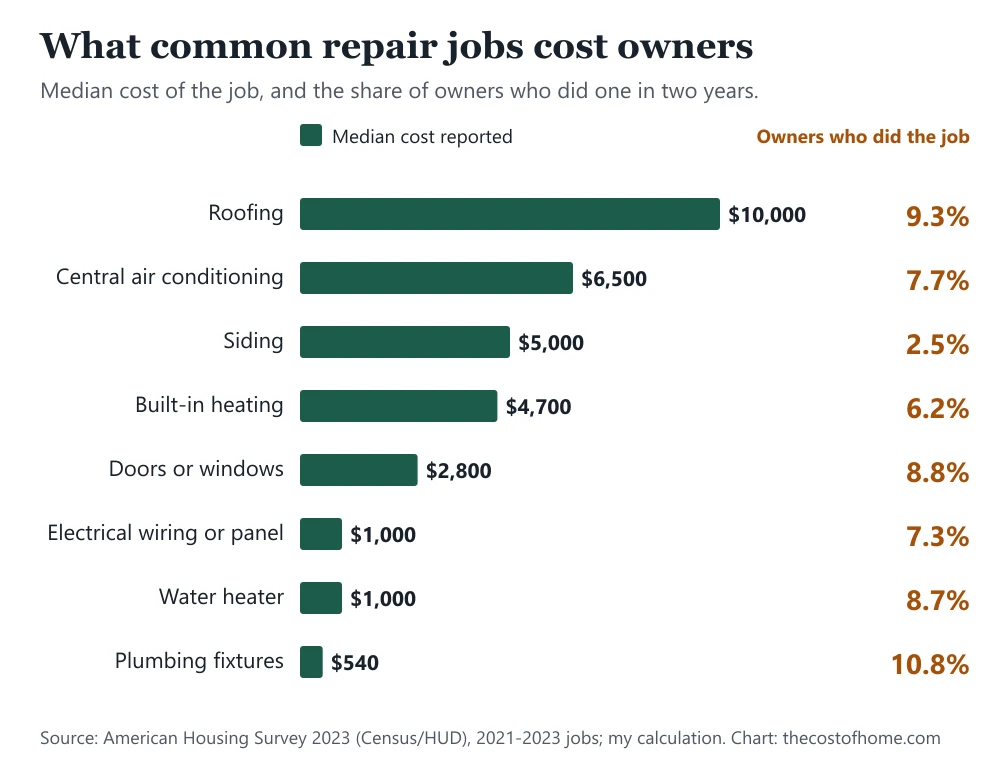
These are what owners say they paid, and they include jobs done by the owner, so they can run below a contractor's price guide. My own guides show the installed prices: what a roof replacement costs, water heater replacement and heat pump prices. For insulation, see attic insulation cost.
What does the Bureau of Labor Statistics say owners spend?
A bigger number, because it counts more. The Bureau's Consumer Expenditure Surveys track what households spend on maintenance, repairs, insurance and other expenses for an owned home, and the category includes homeowners insurance. Homeowners averaged $5,066 in 2025.
| Year | Homeowners | With a mortgage | Without a mortgage | All households, renters included |
|---|---|---|---|---|
| 2025 | $5,066 | $5,259 | $4,816 | $3,303 |
| 2024 | $4,481 | $4,704 | $4,187 | $2,926 |
| 2023 | $3,974 | $3,835 | $4,165 | $2,599 |
| 2022 | $3,911 | $4,050 | $3,715 | $2,559 |
| 2021 | $3,587 | $3,609 | $3,557 | $2,335 |
Average yearly spending on maintenance, repairs, insurance and other expenses for an owned home, per household. The category includes homeowners insurance. Source: Bureau of Labor Statistics, Consumer Expenditure Surveys.
The average rose 41% from 2021 to 2025, by my arithmetic. Insurance is part of it: the National Association of Insurance Commissioners put the average homeowners policy at $1,737 for 2023, which I cover in my guide to homeowners insurance by state. The Bureau's table does not split the two, so I do not subtract one from the other. Property tax is a separate line, covered in my guide to property tax by state.
How much should you set aside?
My read: use 1% of the home's value as a reserve target, not as the bill you expect. The typical owner in the survey spends about a third of that. But about one owner in ten spends 3% or more in a year, and the jobs behind those years, a roof at $10,000 or central air at $6,500, arrive all at once. A savings account funded at a steady rate smooths them out, and what you do not spend stays yours.
I would aim higher in the first years of owning an older house, because the Census numbers above show new owners spending more than twice what longtime owners do. And I would build the figure from your own house: when the roof, the furnace and the water heater were installed, and what each costs to replace today, is worth more than any percentage.
Where do these figures fall short?
- The answers are self-reported. Routine upkeep is each household's own estimate of a typical year, and home value is the owner's estimate too. The Census Bureau adds noise to the public-use file to protect privacy, so my results can differ slightly from its own tables. I checked my code against the check values the Census publishes: a routine-upkeep median of $510 and average of $1,354, and a per-job median of $2,000 and average of $6,170.
- The grouping is mine. The Census Bureau does not publish a total for repairs and system replacements. I built it from the survey's job list, and I divided each owner's two-year jobs by two, which also treats a new owner's shorter stay the same as everyone else's.
- The jobs are from 2021 to 2023. The Bureau of Labor Statistics measure rose 41% from 2021 to 2025, so prices today are likely higher than the ones owners reported.
- The 1% rule has no single source. I used the Extension guide because I could read it in full. Other guides give other ranges.
- Not covered: condo and HOA fees, utilities, the mortgage, and the cost of landscaping contracts and appliances other than those in the job list.
For the other lines in a home budget, see my guides to the costs of owning a home and the big home repairs.
Frequently asked questions
How much should I budget for home maintenance each year?
A Cooperative Extension guide supported by the USDA says most financial experts recommend 1% to 3% of the home's value, which is $3,711 to $11,133 at the median U.S. home value of $371,100. In the 2023 American Housing Survey, the typical owner spent $1,038 a year on routine upkeep plus repairs, so 1% is best treated as a reserve target.
How much does home maintenance cost per month?
At the survey median, routine upkeep is about $43 a month and routine upkeep plus repairs about $87 a month. The average is higher, about $299 a month, because some owners have large bills.
Is the 1% rule of home maintenance accurate?
For most owners it overshoots. About 72% of owners spent less than 1% of their home's value on upkeep and repairs, and 11% spent 3% or more. It fits the cheapest homes best and works as a savings target for the lumpy years.
Do older homes cost more to maintain?
Not by much in the typical case. Owners of homes built before 2010 report a similar median, between $1,089 and $1,209 a year with repairs, and homes built since 2010 report about $494. The Census Bureau's 2021 survey found that new owners of older homes spent more than longtime owners.
What is the most expensive home repair?
Among the common jobs in the survey, roofing has the highest median cost at $10,000, followed by central air conditioning at $6,500 and siding at $5,000. Repairs after a disaster can cost more: the Census Bureau's table shows a median of $21,000 for fire damage.
Does the Bureau of Labor Statistics number include insurance?
Yes. Its category for owned homes covers maintenance, repairs, insurance and other expenses together. Homeowners averaged $5,066 in 2025, and the Bureau's table does not separate the insurance part.
Sources
- U.S. Census Bureau and HUD, American Housing Survey 2023, national public-use file v1.1 (household and project files); routine upkeep question CSTMNT in the 2023 AHS Items Booklet (accessed October 30, 2026)
- U.S. Census Bureau, AHS 2023 Table Specifications and PUF Estimates for User Verification: check values for routine upkeep and home improvement costs (accessed October 30, 2026)
- U.S. Census Bureau, American Housing Survey for the United States: 2023, definitions of home improvement and routine maintenance (accessed October 30, 2026)
- U.S. Census Bureau, Home Improvements infographic, 2023 American Housing Survey: 59% of owners made improvements and spent $827 billion in 2021-2023 (accessed October 30, 2026)
- U.S. Census Bureau, "Cost of Improving and Maintaining Older Homes Higher for New Owners" by Katie Gustafson, 2021 American Housing Survey (October 12, 2023; accessed October 30, 2026)
- U.S. Bureau of Labor Statistics, Consumer Expenditure Surveys: owned dwellings, maintenance, repairs, insurance and other expenses, series CXUOWNEXPENLB1702M, 1703M, 1704M and 0101M, 2021-2025, read through the Bureau's public data API (accessed October 30, 2026)
- U.S. Census Bureau, American Community Survey 2025 1-year estimates, Table B25077: median home value of owner-occupied housing units, $371,100 (see my property tax guide; accessed October 29, 2026)
- Financial Security for All, Cooperative Extension (USDA-supported), "How much money should homeowners set aside each year for maintenance and repairs to their home?" (May 30, 2019; accessed October 30, 2026)
- National Association of Insurance Commissioners, Dwelling Fire, Homeowners Owner-Occupied, and Homeowners Tenant and Condominium/Cooperative Unit Owners Insurance Report: Data for 2023 (see my insurance guide; accessed October 25, 2026)

Founder and editor, The Cost of Home
I write and check every guide on this site myself, working from public data. The sources behind each number are listed at the end of the article, so you can check them too.