Owning a Home
Average Homeowners Insurance Cost by State in 2026
Quick answer
The average U.S. homeowners policy (HO-3) cost $1,737 a year, about $145 a month, in the latest NAIC data, which covers 2023 policies and was published in July 2026. Louisiana was the most expensive state at $3,027 and Wisconsin the cheapest at $923. NAIC data show premiums rising in every region since 2018, so your own quote may be higher.

On this page
- What is the average homeowners insurance cost in each state?
- Which states have the most expensive homeowners insurance?
- Which states have the cheapest homeowners insurance?
- Can you compare states fairly with these averages?
- Why does homeowners insurance cost so much more in some states?
- How does homeowners insurance compare with your electric bill?
- How do you use these numbers when you shop for coverage?
- FAQ
- Sources
What you pay for homeowners insurance depends on where the house is, how much it would cost to rebuild, and what the sky can do to it. A policy that costs $900 a year in Wisconsin can cost more than $3,000 in Louisiana, and neither number says much until you know what it covers.
The figures below come from the National Association of Insurance Commissioners (NAIC), the group of state insurance regulators, which collects premium and policy counts from insurers in every state and publishes them each year. The newest report covers policies written in 2023 and came out in July 2026. It is the NAIC's most recent state-by-state premium report, so the headline "2026" in this guide refers to when the data came out, not when the policies were sold.
The average here is for the HO-3, the standard homeowners policy for a house you live in. It covers the building, your belongings and liability, and it made up 79.5% of all owner-occupied homeowners policies in 2023. Each average is the total premium divided by the number of policy-years sold in that state.
What is the average homeowners insurance cost in each state?
Find your state in the table. The "$275K–$350K coverage" column compares states on equal terms by averaging only policies with $275,000 to $349,999 of coverage on the house. The last column shows how many months of the average electric bill in that state one year of insurance would equal.
| State | Per year | Per month | $275K–$350K coverage | Rank | Months of electricity |
|---|---|---|---|---|---|
| U.S. average | $1,737 | $145 | $1,460 | – | 11.1 |
| Alabama | $1,906 | $159 | $1,854 | 12 | 10.3 |
| Alaska | $1,216 | $101 | $983 | 39 | 7.7 |
| Arizona | $1,194 | $100 | $1,031 | 42 | 7.4 |
| Arkansas | $1,870 | $156 | $1,893 | 13 | 13.3 |
| California | $1,655 | $138 | $1,030 | 21 | 10.3 |
| Colorado | $2,492 | $208 | $1,992 | 4 | 22.2 |
| Connecticut | $2,036 | $170 | $1,459 | 9 | 10.4 |
| Delaware | $1,196 | $100 | $987 | 41 | 7.2 |
| District of Columbia | $1,545 | $129 | $1,084 | 28 | 10.1 |
| Florida | $2,779 | $232 | $2,216 | 3 | 16.4 |
| Georgia | $1,828 | $152 | $1,600 | 16 | 11.3 |
| Hawaii | $1,549 | $129 | $941 | 27 | 6.9 |
| Idaho | $1,135 | $95 | $941 | 45 | 9.9 |
| Illinois | $1,480 | $123 | $1,259 | 32 | 11.3 |
| Indiana | $1,259 | $105 | $1,216 | 36 | 7.9 |
| Iowa | $1,342 | $112 | $1,314 | 34 | 11.1 |
| Kansas | $1,733 | $144 | $1,692 | 20 | 13.1 |
| Kentucky | $1,525 | $127 | $1,486 | 30 | 9.9 |
| Louisiana | $3,027 | $252 | $2,832 | 1 | 19.4 |
| Maine | $1,150 | $96 | $981 | 44 | 7.4 |
| Maryland | $1,578 | $132 | $1,248 | 25 | 7.9 |
| Massachusetts | $2,134 | $178 | $1,420 | 8 | 11.7 |
| Michigan | $1,110 | $93 | $1,009 | 47 | 8.4 |
| Minnesota | $1,988 | $166 | $1,676 | 11 | 16.5 |
| Mississippi | $2,029 | $169 | $2,075 | 10 | 11.8 |
| Missouri | $1,589 | $132 | $1,462 | 24 | 10.9 |
| Montana | $1,768 | $147 | $1,587 | 18 | 15.4 |
| Nebraska | $2,142 | $179 | $2,079 | 7 | 17.5 |
| Nevada | $1,013 | $84 | $815 | 49 | 8.5 |
| New Hampshire | $1,300 | $108 | $1,052 | 35 | 7.6 |
| New Jersey | $1,551 | $129 | $1,076 | 26 | 9.8 |
| New Mexico | $1,490 | $124 | $1,378 | 31 | 15.0 |
| New York | $1,801 | $150 | $1,057 | 17 | 10.8 |
| North Carolina | $1,852 | $154 | $1,674 | 15 | 12.2 |
| North Dakota | $1,414 | $118 | $1,322 | 33 | 10.7 |
| Ohio | $1,116 | $93 | $1,059 | 46 | 7.1 |
| Oklahoma | $2,486 | $207 | $2,536 | 5 | 17.2 |
| Oregon | $1,003 | $84 | $848 | 50 | 7.6 |
| Pennsylvania | $1,217 | $101 | $1,047 | 38 | 7.0 |
| Rhode Island | $2,396 | $200 | $1,762 | 6 | 14.6 |
| South Carolina | $1,753 | $146 | $1,506 | 19 | 10.6 |
| South Dakota | $1,614 | $135 | $1,484 | 23 | 11.5 |
| Tennessee | $1,649 | $137 | $1,518 | 22 | 10.1 |
| Texas | $2,864 | $239 | $2,486 | 2 | 16.3 |
| Utah | $1,107 | $92 | $890 | 48 | 10.7 |
| Vermont | $1,215 | $101 | $979 | 40 | 8.6 |
| Virginia | $1,537 | $128 | $1,274 | 29 | 8.9 |
| Washington | $1,232 | $103 | $963 | 37 | 9.4 |
| West Virginia | $1,179 | $98 | $1,189 | 43 | 7.2 |
| Wisconsin | $923 | $77 | $840 | 51 | 7.4 |
| Wyoming | $1,853 | $154 | $1,702 | 14 | 16.2 |
Average HO-3 premium by state, 2023 policies. Rank 1 = highest premium. Source: NAIC, Homeowners Insurance Report, data for 2023 (July 2026). Electric bill: U.S. EIA, 12 months ending July 2026.
Treat these as a yardstick. Your own premium depends on your home's value and age, the coverage and deductible you choose, your claims history and the insurer you pick.
Which states have the most expensive homeowners insurance?
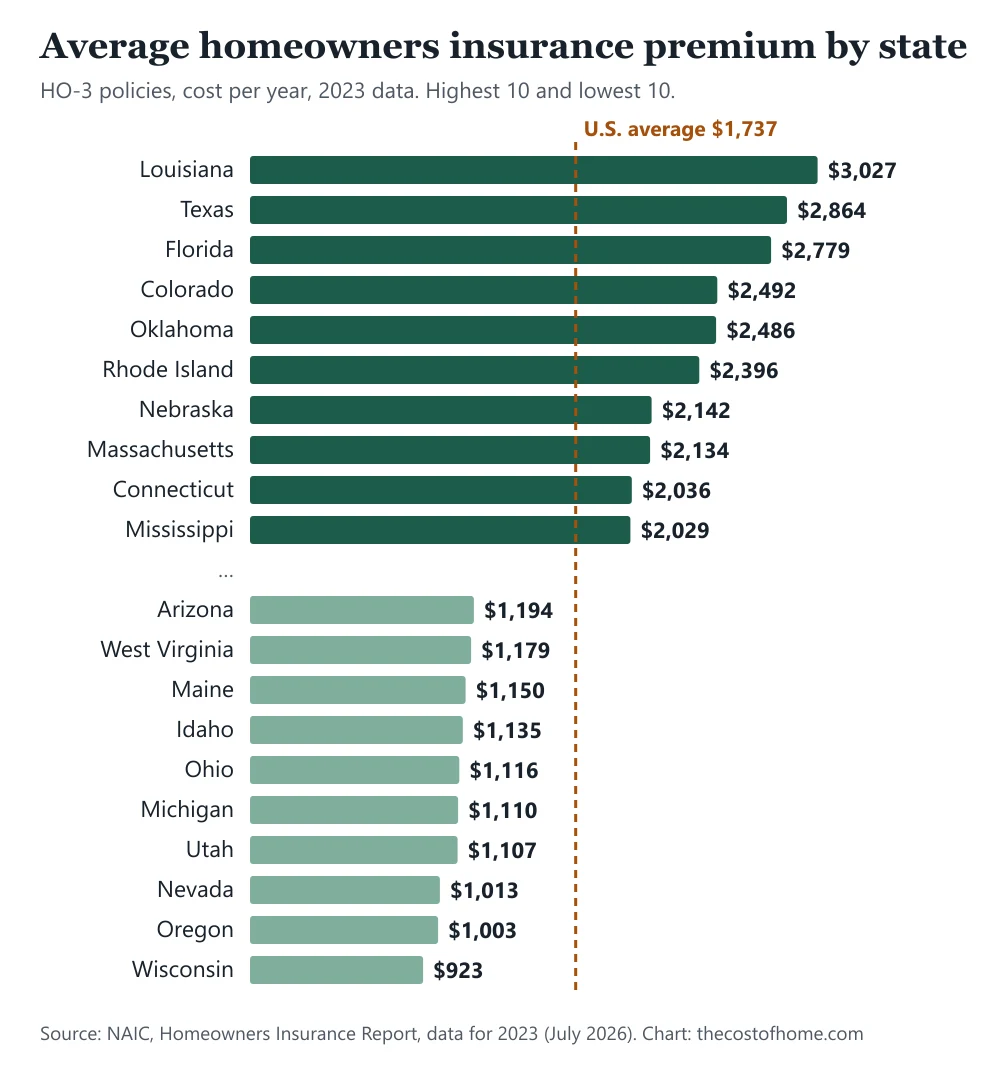
The five states with the highest average HO-3 premium were:
- Louisiana ($3,027 a year, $252 a month)
- Texas ($2,864 a year, $239 a month)
- Florida ($2,779 a year, $232 a month)
- Colorado ($2,492 a year, $208 a month)
- Oklahoma ($2,486 a year, $207 a month)
Louisiana, Texas and Florida sit on the Gulf and Atlantic coasts. The NAIC says hurricane exposure is greatest in the southeastern coastal areas and tornado exposure in the central and southeastern U.S., and Hurricane Ian in Florida, Ida in Louisiana and Katrina on the Gulf Coast are the three costliest insured U.S. natural catastrophes through 2025. The report does not break down premiums by cause state by state, so the ranking reflects all of these factors together.
Which states have the cheapest homeowners insurance?
The five states with the lowest average premium were:
- Wisconsin ($923 a year, $77 a month)
- Oregon ($1,003 a year, $84 a month)
- Nevada ($1,013 a year, $84 a month)
- Utah ($1,107 a year, $92 a month)
- Michigan ($1,110 a year, $93 a month)
The most expensive state costs about 3.3 times as much as the cheapest. The five cheapest are in the Upper Midwest, the Mountain West and the Pacific Northwest, but the ten cheapest also include Ohio, Maine and West Virginia, so there is no single region to point to.
Can you compare states fairly with these averages?
Only partly. The NAIC itself warns that average premium "is an imperfect measure of the relative price of insurance" because hazards, economic conditions and real estate values differ so much from state to state. The biggest distortion is the amount of coverage: a policy on a $900,000 house costs more than one on a $250,000 house even in the same town.
That is why the table has a "$275K–$350K coverage" column. Among policies with $275,000 to $349,999 of coverage on the house, the five highest averages were Louisiana ($2,832), Oklahoma ($2,536), Texas ($2,486), Florida ($2,216), Nebraska ($2,079), and the lowest were Nevada ($815), Wisconsin ($840), Oregon ($848). The Gulf and central states stay near the top on both measures. Some places look very different once coverage is matched:
| State | Average of all HO-3 policies | Policies with $275,000–$349,999 of coverage |
|---|---|---|
| California | $1,655 | $1,030 |
| New York | $1,801 | $1,057 |
| Massachusetts | $2,134 | $1,420 |
| New Jersey | $1,551 | $1,076 |
| Hawaii | $1,549 | $941 |
Same state, two ways of measuring. Source: NAIC, Homeowners Insurance Report, data for 2023 (July 2026).
In these states the average policy insures a much more expensive house, so the overall average is pushed up by the amount of coverage and not only by the risk. Compare the second column with the third before concluding that a state is "expensive" or "cheap".

Why does homeowners insurance cost so much more in some states?
The NAIC points to a handful of drivers that show up in every state's average:
- What it costs to rebuild. Premiums are tied to the amount of insurance, which is based on the value of the house. Real estate values and construction costs tend to be higher in densely populated areas, vacation and retirement areas, and places with fast economic growth.
- Weather and disasters. Wildfires are more common in the West, hurricanes along the southeastern coast and tornadoes in the central and southeastern states. Insured U.S. catastrophe losses for 2016 to 2025 were more than $940 billion in 2025 dollars.
- What the policy covers. Price also moves with the perils covered, the limits and the deductible you choose. The HO-3 covers the building against all risks except those it names as excluded, such as flood, and the NAIC data leave out earthquake coverage.
Premiums have been climbing. The NAIC's previous report found the average HO-3 premium up 11.26% nationwide from 2021 to 2022, and a separate NAIC analysis of insurer data from 2018 to 2024, published in August 2026, found that the average premium per policy rose in every region, by 18.3% to 43.3% after inflation depending on the region. The same analysis found that insurer-initiated nonrenewals rose between 96% and 216% by region, so it is worth comparing more than one quote.
How does homeowners insurance compare with your electric bill?
For the average American home, a year of insurance costs about as much as a year of electricity. The average HO-3 premium of $1,737 equals about 11 months of the average U.S. electric bill of $156, according to our guide to the average electric bill by state.
The balance changes a lot by state. In Colorado, insurance runs $2,492 a year against an electric bill of $1,347, or 22.2 months of electricity. In Hawaii it is the reverse: $1,549 for insurance against $2,685 for electricity, or 6.9 months. The two numbers come from different periods, 2023 policies and the 12 months to July 2026, so read the comparison as a rough guide.
If you are budgeting for a house, put insurance next to the other bills that arrive every month. Our guides to the average natural gas bill by state, how to read your electric bill and why an electric bill runs high cover the utility side, and the winter heating forecast shows what the cold months can add.
How do you use these numbers when you shop for coverage?
- Find your state's average and your coverage level. Check the table, then look at the "$275K–$350K coverage" column if your house is insured for roughly $275,000 to $350,000.
- Ask for quotes on the same terms. Compare the dwelling coverage, the deductible and the liability limit, because a lower price can simply mean less coverage.
- Check what is left out. Flood and earthquake are not part of a standard HO-3, so ask separately if the risk applies where you live.
- Ask about discounts. Insurers often discount for security devices, but not every system qualifies. Our guide to what a home security system costs shows what a discount is worth against a monthly monitoring plan.
- Remember the age of the data. These are 2023 averages. If your quote is above your state's number, your coverage level and premiums rising since 2018 are two likely reasons.
Frequently asked questions
What is the average cost of homeowners insurance in the U.S.?
About $1,737 a year, or $145 a month, for the standard HO-3 policy, based on NAIC data for 2023 policies published in July 2026.
Which state has the most expensive homeowners insurance?
Louisiana, at $3,027 a year. Texas ($2,864) and Florida ($2,779) come next.
Which state has the cheapest homeowners insurance?
Wisconsin, at $923 a year, followed by Oregon ($1,003) and Nevada ($1,013).
Why is my quote higher than the average for my state?
Premiums follow the amount of coverage, the deductible, the perils covered and the age and value of the house. The averages also come from 2023 policies, and NAIC data show premiums rising in every region since 2018.
Does the average include flood or earthquake coverage?
No. The HO-3 covers all risks except those it excludes, and flood is one of them. The NAIC data also leave out earthquake premiums, which are usually added to a policy separately.
What is an HO-3 policy?
The standard homeowners policy for a house you live in. It covers the building against all risks except those it excludes, your belongings against named perils, and your liability. It made up about 79% of owner-occupied homeowners policies in 2023.
How much is homeowners insurance per month?
The national average is about $145 a month. It ranges from about $77 in Wisconsin to about $252 in Louisiana.
Sources
- National Association of Insurance Commissioners, Dwelling Fire, Homeowners Owner-Occupied, and Homeowners Tenant and Condominium/Cooperative Unit Owners Insurance Report: Data for 2023 (July 2026), Table 4 and narrative (accessed October 25, 2026)
- NAIC, "NAIC Releases Homeowners Insurance Report for 2022" (May 21, 2025)
- NAIC, "NAIC Releases First-of-Its-Kind National Analysis of Homeowners Insurance Market Trends" (August 5, 2026)
- U.S. Energy Information Administration, Form EIA-861M: monthly sales, revenue and customers by state (used for the electric bill comparison)

Founder and editor, The Cost of Home
I lived in the United States for five years, and this site grew out of the question every household there keeps asking: what will this cost, and is it worth it? Every number here comes from a public source listed at the end of the article.