Energy Bills
Solar Panel Payback Period by State in 2026
Quick answer
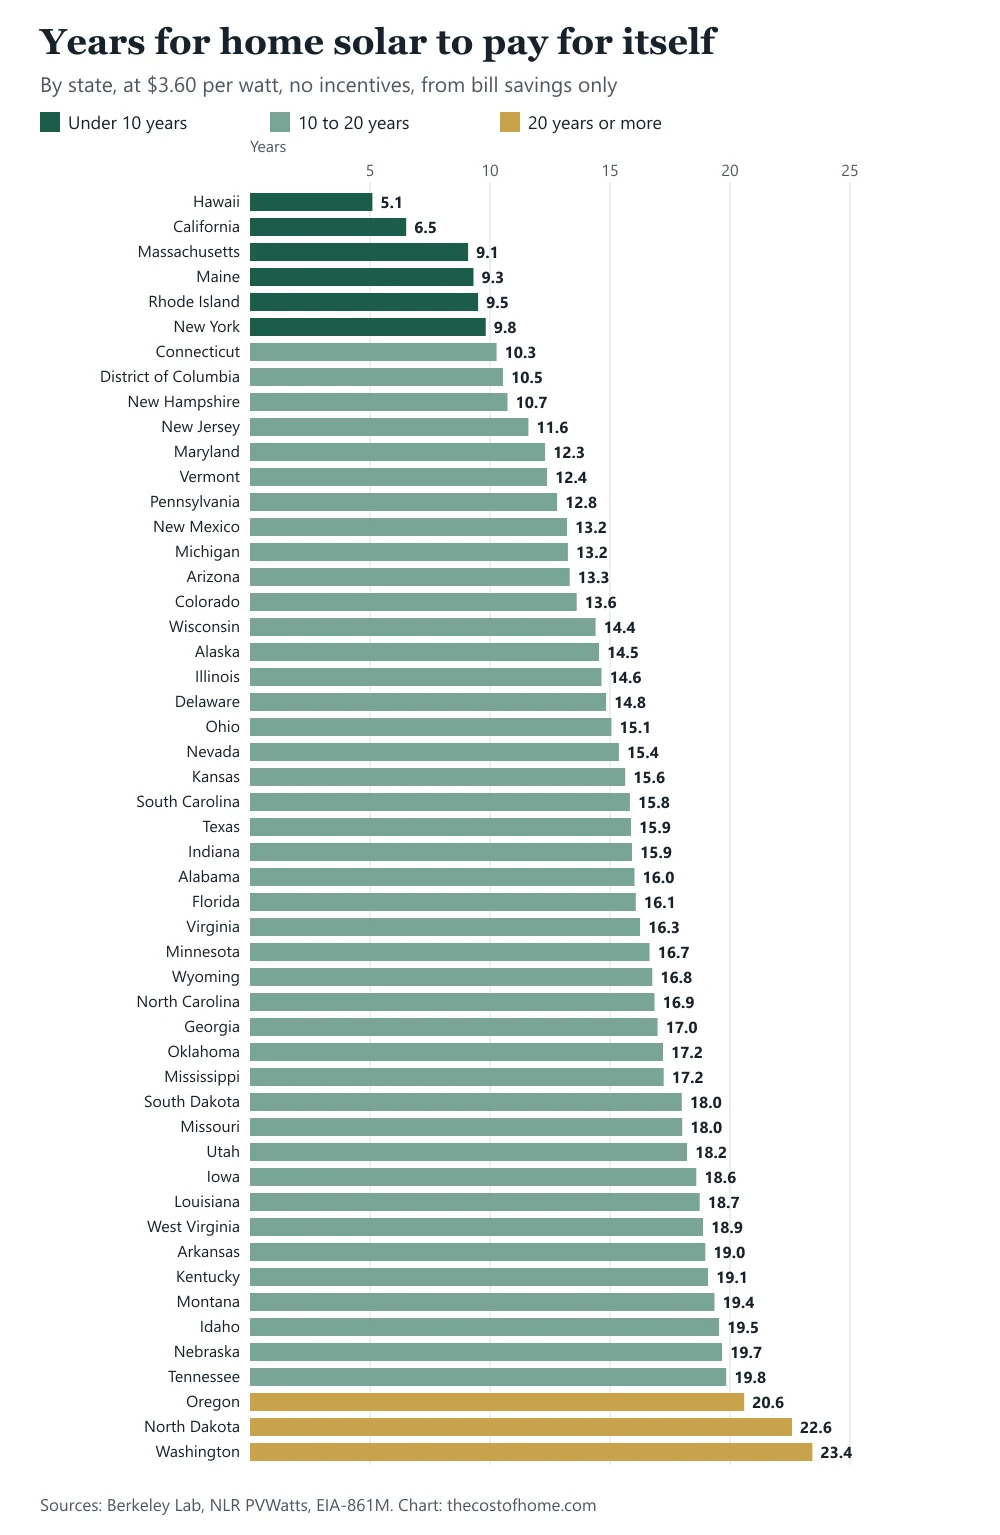
At the national median price of $3.60 per watt, home solar takes about 16 years to pay for itself in the typical state, counting only what it saves on the electric bill. It ranges from about 5 years in Hawaii and 7 in California to more than 20 in Oregon, North Dakota, and Washington. Paying cash, at $3.00 per watt, brings the typical state to about 13 years. These figures include no incentives.
On this page
- How long does it take solar panels to pay for themselves?
- How is the solar payback period calculated?
- Which states have the shortest and longest solar payback?
- Does more sunshine mean a faster payback?
- What is the solar payback in your state?
- How much does the way you pay change the payback?
- Does your state's own installed price change the answer?
- What if your utility pays less for the power you send back?
- How can you estimate your own solar payback?
- What does this guide leave out?
- FAQ
- Sources
Solar panels are sold as an investment that pays you back through lower electric bills, so the question that matters is how many years that takes where you live. The answer is very different from state to state. This guide works it out for all 50 states and Washington, D.C., from three public sources: what Americans paid for rooftop solar in 2025, what a kilowatt of panels produces in each state, and what a kilowatt-hour of electricity costs there.
The payback period here is the simple kind that the U.S. Department of Energy describes: the cost of the system divided by what it saves you each year. It counts only bill savings. It leaves out incentives, loan interest and upkeep, so use it to compare places and payment methods, then check it against a real quote for your own roof.
How long does it take solar panels to pay for themselves?
In the typical state, about 16 years at the median price of $3.60 per watt. That is the middle of the 51 results in this guide, so half of the states pay back faster and half slower. The spread is wide: 5.1 years in Hawaii at the quickest and 23.4 years in Washington at the slowest. By band, 6 places pay back in under 10 years, 15 in 10 to 15 years, 27 in 15 to 20 years and 3 in 20 years or more.
The method of payment moves the answer almost as much as the state does. Cash purchases, at the median $3.00 per watt, bring the typical state down to about 13 years, and 10 places fall under 10 years. At the median $4.50 per watt for loan-financed systems, the typical state rises to about 20 years, and that is before any interest.
How is the solar payback period calculated?
The Department of Energy gives the formula in plain terms: divide the final cost of the system by your annual financial benefit, which is what the panels save you on electricity plus any yearly incentive. Here that becomes the price of a kilowatt of solar, divided by the kilowatt-hours a kilowatt makes in a year times the price you would have paid for each one.
Take Texas, using Houston for the sun. A 7.7 kW system, the U.S. median size for 2025, costs about $27,700 at $3.60 per watt. It makes about 10,942 kWh a year, and at the state's average residential price of 16.0¢ per kWh that is worth about $1,746 a year. $27,700 divided by $1,746 is about 15.9 years.
System size drops out of the math. A bigger system costs more and saves more in the same proportion, so the payback depends on the price per watt, the sun and the price of electricity, which is why one table can cover every state. A home that uses much less power than its panels make is a different case, because the extra is paid at the utility's export rate, covered further down.
Which states have the shortest and longest solar payback?
The shortest paybacks are in the places with the most expensive electricity. Hawaii leads at 5.1 years, followed by California at 6.5, then Massachusetts (9.1), Maine (9.3), Rhode Island (9.5), and New York (9.8). These six states are the only ones under 10 years, and their residential prices of 28.4¢ to 43.5¢ per kWh compare with a U.S. average of 18.0¢.
At the other end, Washington (23.4 years), North Dakota (22.6 years), and Oregon (20.6 years) are the only states at 20 years or more, and Tennessee and Nebraska come in just under 20. Electricity in those three states costs 12.3¢ to 15.5¢ per kWh, so each kilowatt-hour a panel makes is worth less.
Does more sunshine mean a faster payback?
Not by itself. Across the 51 places, a kilowatt of panels makes between 922 kWh a year in Anchorage and 1,779 kWh in Albuquerque, a gap of about 1.9 to 1. Over the same places, the price of a kilowatt-hour runs from 12.3¢ in North Dakota to 43.5¢ in Hawaii, a gap of about 3.5 to 1. The price spread is larger, so it decides more of the ranking.
Arizona against New York shows it. Phoenix makes 1,755 kWh per kilowatt and New York City 1,291 kWh, about 26% less, yet New York pays back in 9.8 years against 13.3 in Arizona, because a kilowatt-hour costs 28.4¢ in New York and 15.4¢ in Arizona. At the other extreme, Washington gets both a low price (14.1¢) and the least sun among the lower 48 states in this table (1,088 kWh per kilowatt in Seattle), which puts it last.
For the electricity side of the equation, see the average electric bill by state guide.
What is the solar payback in your state?
The table lists all 50 states and the District of Columbia, in alphabetical order, at three prices per watt. The middle price column is the one used for the chart and the rankings above.
| State (city used) | Output per kW, per year | Price per kWh | Payback at $3.00 per watt | Payback at $3.60 per watt | Payback at $4.50 per watt |
|---|---|---|---|---|---|
| Alabama (Birmingham) | 1,367 kWh | 16.4¢ | 13.3 years | 16.0 years | 20.0 years |
| Alaska (Anchorage) | 922 kWh | 26.9¢ | 12.1 years | 14.5 years | 18.2 years |
| Arizona (Phoenix) | 1,755 kWh | 15.4¢ | 11.1 years | 13.3 years | 16.7 years |
| Arkansas (Little Rock) | 1,413 kWh | 13.4¢ | 15.8 years | 19.0 years | 23.7 years |
| California (Los Angeles) | 1,677 kWh | 33.0¢ | 5.4 years | 6.5 years | 8.1 years |
| Colorado (Denver) | 1,595 kWh | 16.6¢ | 11.3 years | 13.6 years | 17.0 years |
| Connecticut (Hartford) | 1,252 kWh | 28.0¢ | 8.6 years | 10.3 years | 12.8 years |
| Delaware (Wilmington) | 1,364 kWh | 17.8¢ | 12.4 years | 14.8 years | 18.5 years |
| District of Columbia (Washington) | 1,411 kWh | 24.2¢ | 8.8 years | 10.5 years | 13.2 years |
| Florida (Jacksonville) | 1,455 kWh | 15.4¢ | 13.4 years | 16.1 years | 20.1 years |
| Georgia (Atlanta) | 1,402 kWh | 15.1¢ | 14.2 years | 17.0 years | 21.2 years |
| Hawaii (Honolulu) | 1,622 kWh | 43.5¢ | 4.3 years | 5.1 years | 6.4 years |
| Idaho (Boise) | 1,456 kWh | 12.7¢ | 16.3 years | 19.5 years | 24.4 years |
| Illinois (Chicago) | 1,308 kWh | 18.8¢ | 12.2 years | 14.6 years | 18.3 years |
| Indiana (Indianapolis) | 1,335 kWh | 16.9¢ | 13.3 years | 15.9 years | 19.9 years |
| Iowa (Des Moines) | 1,370 kWh | 14.1¢ | 15.5 years | 18.6 years | 23.2 years |
| Kansas (Wichita) | 1,526 kWh | 15.1¢ | 13.0 years | 15.6 years | 19.5 years |
| Kentucky (Louisville) | 1,355 kWh | 13.9¢ | 15.9 years | 19.1 years | 23.9 years |
| Louisiana (New Orleans) | 1,479 kWh | 13.0¢ | 15.6 years | 18.7 years | 23.4 years |
| Maine (Portland) | 1,319 kWh | 29.3¢ | 7.8 years | 9.3 years | 11.6 years |
| Maryland (Baltimore) | 1,392 kWh | 21.0¢ | 10.2 years | 12.3 years | 15.4 years |
| Massachusetts (Boston) | 1,302 kWh | 30.4¢ | 7.6 years | 9.1 years | 11.4 years |
| Michigan (Detroit) | 1,291 kWh | 21.1¢ | 11.0 years | 13.2 years | 16.6 years |
| Minnesota (Minneapolis) | 1,333 kWh | 16.2¢ | 13.9 years | 16.7 years | 20.8 years |
| Mississippi (Jackson) | 1,414 kWh | 14.8¢ | 14.4 years | 17.2 years | 21.5 years |
| Missouri (Kansas City) | 1,433 kWh | 13.9¢ | 15.0 years | 18.0 years | 22.5 years |
| Montana (Billings) | 1,344 kWh | 13.8¢ | 16.1 years | 19.4 years | 24.2 years |
| Nebraska (Omaha) | 1,423 kWh | 12.9¢ | 16.4 years | 19.7 years | 24.6 years |
| Nevada (Las Vegas) | 1,753 kWh | 13.4¢ | 12.8 years | 15.4 years | 19.2 years |
| New Hampshire (Manchester) | 1,258 kWh | 26.7¢ | 8.9 years | 10.7 years | 13.4 years |
| New Jersey (Newark) | 1,305 kWh | 23.8¢ | 9.7 years | 11.6 years | 14.5 years |
| New Mexico (Albuquerque) | 1,779 kWh | 15.3¢ | 11.0 years | 13.2 years | 16.5 years |
| New York (New York City) | 1,291 kWh | 28.4¢ | 8.2 years | 9.8 years | 12.3 years |
| North Carolina (Charlotte) | 1,446 kWh | 14.8¢ | 14.0 years | 16.9 years | 21.1 years |
| North Dakota (Fargo) | 1,294 kWh | 12.3¢ | 18.8 years | 22.6 years | 28.2 years |
| Ohio (Columbus) | 1,310 kWh | 18.3¢ | 12.5 years | 15.1 years | 18.8 years |
| Oklahoma (Oklahoma City) | 1,527 kWh | 13.7¢ | 14.3 years | 17.2 years | 21.5 years |
| Oregon (Portland) | 1,128 kWh | 15.5¢ | 17.2 years | 20.6 years | 25.7 years |
| Pennsylvania (Philadelphia) | 1,359 kWh | 20.7¢ | 10.7 years | 12.8 years | 16.0 years |
| Rhode Island (Providence) | 1,294 kWh | 29.3¢ | 7.9 years | 9.5 years | 11.9 years |
| South Carolina (Charleston) | 1,454 kWh | 15.6¢ | 13.2 years | 15.8 years | 19.8 years |
| South Dakota (Sioux Falls) | 1,409 kWh | 14.2¢ | 15.0 years | 18.0 years | 22.5 years |
| Tennessee (Nashville) | 1,338 kWh | 13.6¢ | 16.5 years | 19.8 years | 24.8 years |
| Texas (Houston) | 1,421 kWh | 16.0¢ | 13.2 years | 15.9 years | 19.8 years |
| Utah (Salt Lake City) | 1,484 kWh | 13.3¢ | 15.2 years | 18.2 years | 22.8 years |
| Vermont (Burlington) | 1,222 kWh | 23.8¢ | 10.3 years | 12.4 years | 15.5 years |
| Virginia (Richmond) | 1,344 kWh | 16.5¢ | 13.5 years | 16.3 years | 20.3 years |
| Washington (Seattle) | 1,088 kWh | 14.1¢ | 19.5 years | 23.4 years | 29.3 years |
| West Virginia (Charleston) | 1,232 kWh | 15.5¢ | 15.7 years | 18.9 years | 23.6 years |
| Wisconsin (Milwaukee) | 1,334 kWh | 18.7¢ | 12.0 years | 14.4 years | 18.0 years |
| Wyoming (Cheyenne) | 1,533 kWh | 14.0¢ | 14.0 years | 16.8 years | 21.0 years |
Years for home solar to pay for itself in each state, from electric bill savings alone. Output is the yearly kilowatt-hours (kWh) from 1 kilowatt (kW) of panels in the city shown, from NLR's PVWatts calculator (fixed, roof-mounted, south-facing panels, 20° tilt, 14% system losses). Price is the average residential price per kWh, August 2025 to July 2026 (preliminary). Payback is the system price per kW divided by output times price, at $3.00 per watt (median for cash purchases), $3.60 (median for all owner-owned systems) and $4.50 (median for loan-financed systems, before loan interest). No incentives. Sources: Lawrence Berkeley National Laboratory; NLR PVWatts v8; U.S. EIA-861M.
Each state is represented by one large city, so a different city can differ somewhat in output. Electricity prices are the state average, and your own rate depends on your utility and your plan.
How much does the way you pay change the payback?
A lot. Berkeley Lab's 2025 medians were $3.00 per watt for cash purchases, $3.60 for all owner-owned systems and $4.50 for loan-financed systems. Across the states, that moves the payback from between 4.3 and 19.5 years for cash buyers to between 6.4 and 29.3 years at the loan-financed price.
The loan figure needs two cautions. Berkeley Lab says loan fees rolled into the up-front price may explain part of the gap with cash, and the price does not include the interest you pay over the life of the loan. Paying that interest would lengthen the payback further, which is not counted here. And a battery pushes it up again: at Berkeley Lab's median of $4.90 per watt for systems with storage, the typical state would be about 22 years before counting anything a battery saves or earns. For the price side in detail, see how much solar panels cost.
Does your state's own installed price change the answer?
It can. The rankings above use one national price so that the states compare on sun and electricity alone. Berkeley Lab also published a median price for 16 states with at least 20 records, from $3.0 to $4.1 per watt, and using each state's own price changes some results noticeably.
| State | State median price per watt | Payback at the state's price | Payback at $3.60 per watt |
|---|---|---|---|
| California | $3.3 | 6.0 years | 6.5 years |
| Massachusetts | $3.4 | 8.6 years | 9.1 years |
| Rhode Island | $3.5 | 9.2 years | 9.5 years |
| Connecticut | $3.3 | 9.4 years | 10.3 years |
| New York | $3.9 | 10.6 years | 9.8 years |
| New Hampshire | $3.7 | 11.0 years | 10.7 years |
| Arizona | $3.1 | 11.5 years | 13.3 years |
| New Jersey | $3.7 | 11.9 years | 11.6 years |
| Maryland | $4.0 | 13.7 years | 12.3 years |
| Florida | $3.1 | 13.8 years | 16.1 years |
| New Mexico | $4.1 | 15.0 years | 13.2 years |
| Wisconsin | $3.9 | 15.6 years | 14.4 years |
| Texas | $4.0 | 17.6 years | 15.9 years |
| North Carolina | $4.1 | 19.2 years | 16.9 years |
| Oregon | $3.4 | 19.4 years | 20.6 years |
| Washington | $3.0 | 19.5 years | 23.4 years |
Payback in the 16 states where Berkeley Lab had at least 20 records, using each state's own median price per watt for systems installed in 2025 (host-owned, stand-alone, before incentives) and the same sun and electricity price as the table above. The last column repeats the payback at the U.S. median of $3.60 per watt. Sources: Lawrence Berkeley National Laboratory; NLR PVWatts v8; U.S. EIA-861M.
California, at $3.3, comes out at 6.0 years. North Carolina, at $4.1, rises from 16.9 to 19.2 years. Washington has the lowest price of the 16, $3.0 per watt, and is still the slowest state in the table at 19.5 years. In states where the data is thin, ask for several quotes, since the median is only a midpoint.
What if your utility pays less for the power you send back?
Then the payback is longer than this guide shows. The numbers assume every kilowatt-hour your panels make is worth the full average price. The Energy Information Administration (EIA) says solar generation is usually reimbursed at the same retail rate customers pay for grid power, but some states pay lower rates, such as wholesale prices, for what goes back to the grid, and it says lower compensation “leads to longer payback periods for residential solar PV equipment.” Its 2020 article names New York, which moved to value-based compensation for new systems, and Arizona, which uses an avoided-cost method that sits between retail and wholesale.
California matters most here, since it ranks second in this guide. The California Public Utilities Commission says that since April 15, 2023, customers applying for interconnection take service on the net billing tariff, under which compensation for excess power exported to the grid is applied “at a rate reflecting the value of this generation to the grid.” Under the earlier net metering rules, those credits were applied “at the retail rates.” The commission also says that under both, onsite generation is first used to serve onsite load, which offsets what you would have bought. So the 6.5 years in the table assume a retail-rate credit for exports that new California systems no longer get. Since the EIA says lower compensation leads to longer paybacks, a new system is likely to take longer, and by how much depends on how much of its output you use as it is made.
How can you estimate your own solar payback?
- Get the price after incentives. Take the quote and subtract any state, local or utility incentive you qualify for. The federal credit is gone for systems placed in service after 2025.
- Estimate the yearly savings. Multiply the kilowatt-hours the installer says the system will make in a year by what each kilowatt-hour costs you. The rate is on your bill, as explained in how to read your electric bill. If your utility pays less for exports, use that lower rate for the share you send to the grid.
- Divide. The price from step 1 divided by the savings from step 2 is your payback in years.
A larger home load shifts the picture. A house that adds an electric car, electric heat or a heat pump uses more power and can use more of what the panels make. See what it costs to charge an electric car at home and heat pump vs gas furnace cost.
What does this guide leave out?
- Your own quote. Berkeley Lab's installer medians ranged from $2.4 to $6.3 per watt in 2025, so a real quote can pay back far faster or slower than the national median.
- Export rules and timing. The numbers value every kilowatt-hour at the average price. A utility that pays less for exports, or charges differently by time of day, changes the result.
- Fixed charges. The average price is revenue divided by sales, so it includes monthly fixed charges that solar does not reduce. The savings per kilowatt-hour you avoid can be lower than the average price, which lengthens the payback.
- Rising prices. The Department of Energy says the faster electricity costs rise, the shorter the payback. The U.S. average residential price was 18.3¢ per kWh in July 2026, 5% above July 2025, and this guide holds prices flat at the 12-month average of 18.0¢.
- Interest, upkeep and aging. Loan interest, maintenance and the slow decline in output as panels age are not counted.
- Incentives. State, local and utility programs are not in these numbers.
- Your roof and your home. The output assumes south-facing panels at a 20° tilt with 14% system losses, in one large city per state. Shade, direction and home size change the result.
The method behind every number on this site is in how we research costs. More guides on what it costs to run a home are in the Energy Bills section, and why your electric bill is so high covers the other side of the savings.
Frequently asked questions
What is the average payback period for solar panels in the U.S.?
At the median price of $3.60 per watt, the typical state pays back in about 16 years from bill savings alone, with no incentives. That is the middle of the 50 states and D.C., not a figure weighted by population. The range is from 5.1 years in Hawaii to 23.4 years in Washington.
Which state has the shortest solar payback?
Hawaii, at about 5.1 years, then California at 6.5, Massachusetts at 9.1, Maine at 9.3, Rhode Island at 9.5 and New York at 9.8. All have some of the highest electricity prices in the country. California's number assumes full retail credit for the power exported, which new systems no longer get.
Do sunnier states have a shorter solar payback?
Not necessarily. Electricity prices differ more between states than sunshine does. New York City makes about 26% less power per kilowatt than Phoenix but pays back in 9.8 years against 13.3, because a kilowatt-hour costs 28.4¢ there and 15.4¢ in Arizona.
How do you calculate the payback period for solar panels?
Divide the final cost of the system, after any upfront incentive, by the annual financial benefit, which is what you save on electricity plus any yearly incentive, as the Department of Energy describes. The result is the number of years until the savings equal the cost.
Is there still a federal tax credit for solar panels?
No. The IRS says the Residential Clean Energy Credit is not available for any property placed in service after December 31, 2025. The numbers in this guide include no incentive, and state, local or utility programs may still lower your cost.
Does paying cash make solar pay back faster?
Yes. At Berkeley Lab's 2025 median of $3.00 per watt for cash purchases, the typical state pays back in about 13 years, against about 20 years at the loan-financed median of $4.50, before loan interest. Berkeley Lab says loan fees in the price may explain part of the gap.
Does a battery lengthen the payback?
On the price alone, yes. Berkeley Lab's median for systems with a battery was $4.90 per watt, which puts the typical state near 22 years before counting anything the battery saves or earns, such as backup power or better use of your own solar.
What if my utility pays less for exported solar power?
The payback is longer than these figures. The EIA says lower compensation than the retail rate leads to longer payback periods, and the California Public Utilities Commission says new California systems since April 15, 2023 are paid for exports at a rate reflecting the value of that power to the grid, not the retail rate. Ask your utility how it credits exports.
Sources
- U.S. Department of Energy, "Will I Save Money with Solar Energy?" (August 1, 2024; how to calculate the solar payback period and the factors that affect it; accessed October 26, 2026)
- Lawrence Berkeley National Laboratory, "U.S. Distributed Solar and Storage, 2026 Data Update" (August 2026; slides 8, 9, 35 and 37: median installed price per watt in 2025 for cash, all owner-owned, loan-financed and battery systems, and by state; accessed October 20, 2026)
- National Laboratory of the Rockies (NLR, formerly the National Renewable Energy Laboratory), PVWatts Calculator, API version 8.5.0 (output of 1 kW of fixed, roof-mounted, south-facing panels at a 20-degree tilt with 14% losses, standard modules; accessed October 20, 2026)
- U.S. Energy Information Administration, Form EIA-861M: residential revenue and sales by state, August 2025 to July 2026, preliminary (used to compute the average price per kWh; accessed October 15, 2026)
- U.S. Energy Information Administration, "Lower compensation rates for residential solar PV generation could reduce overall adoption," Today in Energy (March 25, 2020; retail-rate and lower compensation for exported power, payback periods; accessed October 26, 2026)
- California Public Utilities Commission, Net Energy Metering (undated page; net billing tariff since April 15, 2023 and how exports are credited; accessed October 26, 2026)
- Internal Revenue Service, Residential Clean Energy Credit (page last reviewed or updated July 4, 2026; credit not available for property placed in service after December 31, 2025; accessed October 26, 2026)

Founder and editor, The Cost of Home
I lived in the United States for five years, and this site grew out of the question every household there keeps asking: what will this cost, and is it worth it? Every number here comes from a public source listed at the end of the article.