Energy Bills
How Much Do Solar Panels Cost in 2026?
Quick answer
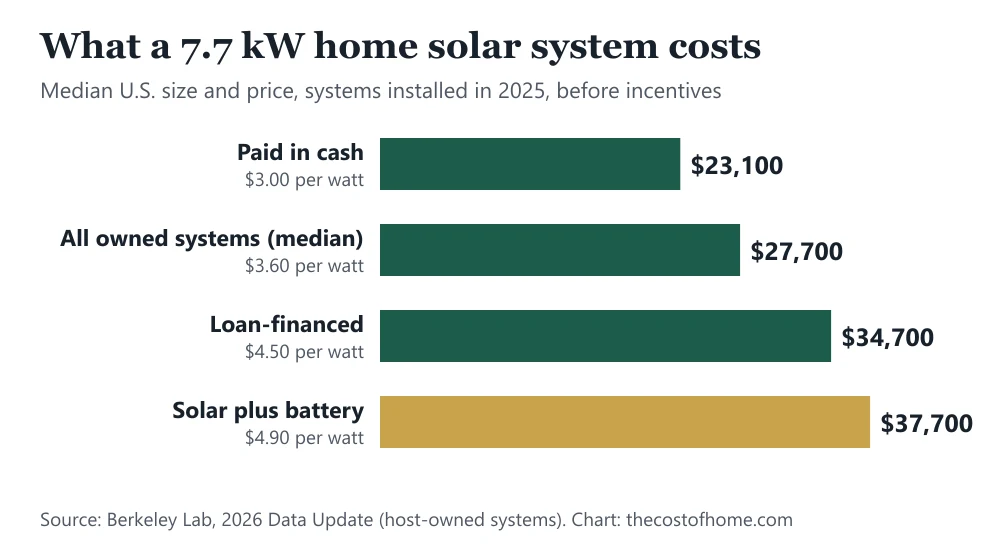
The latest national data, for systems installed in 2025, puts the median price of home solar at $3.60 per watt before incentives. For the median 7.7 kW system, that is about $27,700. Cash buyers paid about $3.00 per watt ($23,100), loan-financed systems about $4.50 ($34,700), and adding a battery brings the price to about $4.90 per watt. The federal tax credit no longer applies to systems placed in service after 2025.
On this page
- How much do solar panels cost per watt?
- How much does a typical home solar system cost?
- How much more does solar cost with a battery?
- Is there still a federal tax credit for solar panels?
- Why do solar quotes vary so much?
- How much does solar cost in your state?
- How big a system do you need, and how much will it make?
- What does this guide leave out?
- FAQ
- Sources
A solar quote is a single number, but it is really a price per watt times the size of the system. Once you know the price per watt, you can check any quote against what other homeowners paid. This guide uses the most recent national data on what Americans paid for rooftop solar, then adds what the panels make in each state and how big a system has to be to match an average home's electricity use.
The prices come from Lawrence Berkeley National Laboratory (Berkeley Lab), which collects project-level data on distributed solar systems for the U.S. Department of Energy. Its August 2026 update covers roughly 5.3 million systems, including about 450,000 installed in 2025, or 93% of that year's U.S. market. The price it reports is the up-front amount the owner paid, before any incentive, in 2025 dollars per watt of panel capacity. The figures here cover systems the homeowner owns, whether bought with cash or a loan. Leases and power purchase agreements, which Berkeley Lab calls third-party ownership, have no up-front price in this data.
How much do solar panels cost per watt?
The median price of a home solar system installed in 2025 was $3.60 per watt, down from $4.10 in 2024. Berkeley Lab puts the drop at $0.5 per watt after adjusting for inflation. Over the past two decades, Berkeley Lab says installed prices have fallen by $9 to $11 per watt across home, business and larger systems, a 70% to 80% drop after inflation, most of it before 2014. Since then the decline has averaged $0.1 to $0.2 per watt a year.
How you pay makes a big difference. Among systems where Berkeley Lab could tell how the owner paid, cash purchases had a median of $3.00 per watt and loan-financed systems $4.50 per watt, a gap of $1.50 per watt. The report says loan origination fees rolled into the up-front price may explain part of the difference. The prices do not include the interest you pay over the life of a loan.
How much does a typical home solar system cost?
The median residential system installed in 2025 was 7.7 kW, up 0.5 kW from 2024. Most systems fell between about 5 and 12 kW. At the median price of $3.60 per watt, a 7.7 kW system costs about $27,700. Paid in cash, the same system costs about $23,100, and financed with a loan, about $34,700.
| System size | Cash purchase | All owner-owned systems | Loan-financed | With a battery |
|---|---|---|---|---|
| 5 kW | $15,000 | $18,000 | $22,500 | $24,500 |
| 7.7 kW (U.S. median size) | $23,100 | $27,700 | $34,700 | $37,700 |
| 10 kW | $30,000 | $36,000 | $45,000 | $49,000 |
| 12 kW | $36,000 | $43,200 | $54,000 | $58,800 |
What a home solar system costs by size and how it is paid for, before any incentive. Each price is the system size in kilowatts (kW) times Berkeley Lab's median price per watt for systems installed in 2025: $3.00 for cash purchases, $3.60 for all owner-owned systems, $4.50 for loan-financed systems and $4.90 (per watt of solar) when a battery is included. Rounded to the nearest $100. Source: Lawrence Berkeley National Laboratory, 2026 Data Update.
Multiplying by a single price per watt is a fair way to size up a quote, because Berkeley Lab did not find a clear price break for bigger residential systems in its 2025 data. The median was highest for the smallest systems ($4.5 per watt under 2 kW) and lowest for the largest ($3.2 per watt above 12 kW), but the pattern in between was uneven. Treat the table as a yardstick, not a quote, since your own price depends on your installer, roof and state.
How much more does solar cost with a battery?
About $1.30 more per watt overall. Berkeley Lab prices systems that include a battery per watt of solar capacity so they compare directly with solar alone. The median for these paired systems was $4.90 per watt, against $3.60 for solar alone. Among cash purchases the gap was $2.1 per watt ($5.1 against $3.0). At the median size, a 7.7 kW system with a battery comes to about $37,700.
Batteries are becoming a normal part of the quote. In 2025, 37% of new residential solar systems were paired with storage, up from 25% in 2024, and the median battery held 13.5 kWh. Much of that growth came from California, which also supplies about 80% of the price records for paired systems, so the figure leans toward California prices.
Is there still a federal tax credit for solar panels?
Not for new systems. The IRS says the Residential Clean Energy Credit, the federal credit that covered solar panels on a home you own, “is not available for any property placed in service after December 31, 2025.” The prices in this guide are before incentives, so for a system you buy in 2026 they are close to what you pay out of pocket, minus any state, local or utility incentive that applies to you.
Those local programs vary widely, and so do the rules for selling extra power back to the grid, so check both with your utility and state energy office before you compare quotes. Leases and power purchase agreements, which accounted for 40% of residential installs in 2025, work differently: you pay a monthly fee instead of buying the system, so there is no up-front price to compare with this guide.
Why do solar quotes vary so much?
- The installer. The median prices of the 100 largest residential installers in 2025 ranged from $2.4 to $6.3 per watt. About 60% were under $4, almost 25% were under $3 and about 10% were above $5. Even for one installer, prices on individual projects typically spanned $1 to $2 per watt.
- How you pay. Loan-financed systems cost about $1.50 per watt more than cash purchases in the data, partly because of loan fees built into the price.
- Your state. Among the 16 states with enough records, the median ran from $3.0 per watt in Washington to $4.1 in North Carolina. Berkeley Lab says gaps like these can reflect financing choices, market size, population density and permitting.
- A battery. Adding storage raised the median price from $3.60 to $4.90 per watt.
- What is not the panels. Soft costs and other balance-of-system costs make up roughly 80% of the installed price. Berkeley Lab counts customer acquisition, installation labor, permitting and interconnection, financing fees for some loans, taxes and profit as soft costs. The panels and the inverter are the smaller part.
How much does solar cost in your state?
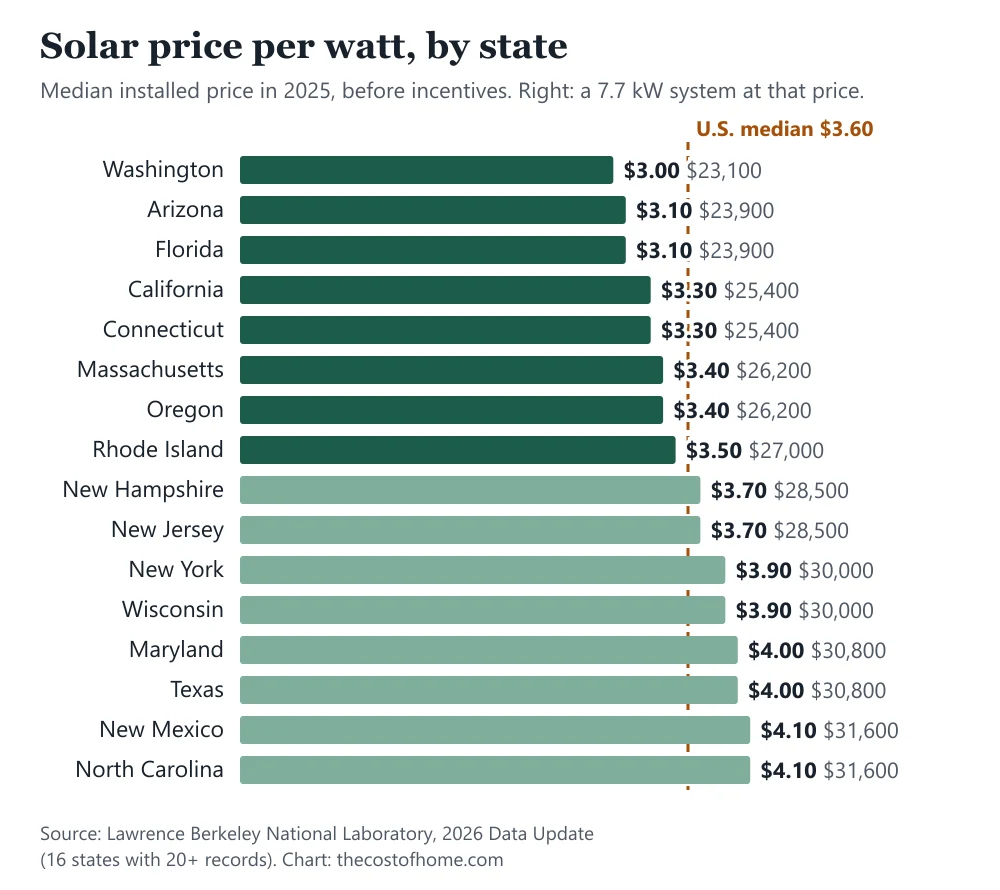
Among the 16 states where Berkeley Lab had enough records to publish a median, Washington was the cheapest at $3.0 per watt and New Mexico and North Carolina the most expensive at $4.1. California, which makes up roughly half of the residential sample, came in at $3.3.
| State | Median price per watt | A 7.7 kW system |
|---|---|---|
| Washington | $3.0 | $23,100 |
| Arizona | $3.1 | $23,900 |
| Florida | $3.1 | $23,900 |
| California | $3.3 | $25,400 |
| Connecticut | $3.3 | $25,400 |
| Massachusetts | $3.4 | $26,200 |
| Oregon | $3.4 | $26,200 |
| Rhode Island | $3.5 | $27,000 |
| New Hampshire | $3.7 | $28,500 |
| New Jersey | $3.7 | $28,500 |
| New York | $3.9 | $30,000 |
| Wisconsin | $3.9 | $30,000 |
| Maryland | $4.0 | $30,800 |
| Texas | $4.0 | $30,800 |
| New Mexico | $4.1 | $31,600 |
| North Carolina | $4.1 | $31,600 |
Median installed price of a residential solar system in 2025, by state, for the 16 states where Berkeley Lab had at least 20 records (host-owned, stand-alone systems, before incentives). The last column prices a 7.7 kW system at each state's median. The U.S. median of $3.60 per watt covers all states, including those with too few records to show here. Source: Lawrence Berkeley National Laboratory, 2026 Data Update.
The cheapest state to install in is not always the best place to put panels. A cheaper price per watt matters less if the sun delivers less per watt, which is what the next section shows.
How big a system do you need, and how much will it make?
One kilowatt of south-facing roof panels makes about 922 kWh a year in Anchorage and about 1,779 kWh in Albuquerque, among the 51 places in the table below. A 7.7 kW system multiplies that by 7.7. The average U.S. home used about 10,440 kWh a year, so the size that matches an average home's use ranges from about 3.5 kW in California to 10.7 kW in Tennessee. At $3.60 per watt, that is about $12,500 to $38,700.
| State (city used) | Output per kW, per year | A 7.7 kW system makes | Average home uses | System to match that use | Cost at $3.60 per watt |
|---|---|---|---|---|---|
| Alabama (Birmingham) | 1,367 kWh | 10,530 kWh | 13,500 kWh | 9.9 kW | $35,600 |
| Alaska (Anchorage) | 922 kWh | 7,100 kWh | 7,044 kWh | 7.6 kW | $27,500 |
| Arizona (Phoenix) | 1,755 kWh | 13,510 kWh | 12,624 kWh | 7.2 kW | $25,900 |
| Arkansas (Little Rock) | 1,413 kWh | 10,880 kWh | 12,576 kWh | 8.9 kW | $32,000 |
| California (Los Angeles) | 1,677 kWh | 12,910 kWh | 5,844 kWh | 3.5 kW | $12,500 |
| Colorado (Denver) | 1,595 kWh | 12,280 kWh | 8,124 kWh | 5.1 kW | $18,300 |
| Connecticut (Hartford) | 1,252 kWh | 9,640 kWh | 8,388 kWh | 6.7 kW | $24,100 |
| Delaware (Wilmington) | 1,364 kWh | 10,500 kWh | 11,148 kWh | 8.2 kW | $29,400 |
| District of Columbia (Washington) | 1,411 kWh | 10,860 kWh | 7,560 kWh | 5.4 kW | $19,300 |
| Florida (Jacksonville) | 1,455 kWh | 11,200 kWh | 13,188 kWh | 9.1 kW | $32,600 |
| Georgia (Atlanta) | 1,402 kWh | 10,800 kWh | 12,828 kWh | 9.1 kW | $32,900 |
| Hawaii (Honolulu) | 1,622 kWh | 12,490 kWh | 6,168 kWh | 3.8 kW | $13,700 |
| Idaho (Boise) | 1,456 kWh | 11,210 kWh | 10,848 kWh | 7.5 kW | $26,800 |
| Illinois (Chicago) | 1,308 kWh | 10,070 kWh | 8,400 kWh | 6.4 kW | $23,100 |
| Indiana (Indianapolis) | 1,335 kWh | 10,280 kWh | 11,220 kWh | 8.4 kW | $30,300 |
| Iowa (Des Moines) | 1,370 kWh | 10,550 kWh | 10,272 kWh | 7.5 kW | $27,000 |
| Kansas (Wichita) | 1,526 kWh | 11,750 kWh | 10,500 kWh | 6.9 kW | $24,800 |
| Kentucky (Louisville) | 1,355 kWh | 10,430 kWh | 13,284 kWh | 9.8 kW | $35,300 |
| Louisiana (New Orleans) | 1,479 kWh | 11,390 kWh | 14,400 kWh | 9.7 kW | $35,100 |
| Maine (Portland) | 1,319 kWh | 10,160 kWh | 6,384 kWh | 4.8 kW | $17,400 |
| Maryland (Baltimore) | 1,392 kWh | 10,720 kWh | 11,340 kWh | 8.1 kW | $29,300 |
| Massachusetts (Boston) | 1,302 kWh | 10,030 kWh | 7,176 kWh | 5.5 kW | $19,800 |
| Michigan (Detroit) | 1,291 kWh | 9,940 kWh | 7,560 kWh | 5.9 kW | $21,100 |
| Minnesota (Minneapolis) | 1,333 kWh | 10,260 kWh | 8,904 kWh | 6.7 kW | $24,000 |
| Mississippi (Jackson) | 1,414 kWh | 10,890 kWh | 13,920 kWh | 9.8 kW | $35,400 |
| Missouri (Kansas City) | 1,433 kWh | 11,030 kWh | 12,492 kWh | 8.7 kW | $31,400 |
| Montana (Billings) | 1,344 kWh | 10,350 kWh | 9,948 kWh | 7.4 kW | $26,600 |
| Nebraska (Omaha) | 1,423 kWh | 10,960 kWh | 11,448 kWh | 8.0 kW | $29,000 |
| Nevada (Las Vegas) | 1,753 kWh | 13,500 kWh | 10,728 kWh | 6.1 kW | $22,000 |
| New Hampshire (Manchester) | 1,258 kWh | 9,690 kWh | 7,692 kWh | 6.1 kW | $22,000 |
| New Jersey (Newark) | 1,305 kWh | 10,050 kWh | 7,968 kWh | 6.1 kW | $22,000 |
| New Mexico (Albuquerque) | 1,779 kWh | 13,700 kWh | 7,788 kWh | 4.4 kW | $15,800 |
| New York (New York City) | 1,291 kWh | 9,940 kWh | 7,044 kWh | 5.5 kW | $19,600 |
| North Carolina (Charlotte) | 1,446 kWh | 11,130 kWh | 12,348 kWh | 8.5 kW | $30,700 |
| North Dakota (Fargo) | 1,294 kWh | 9,960 kWh | 12,900 kWh | 10.0 kW | $35,900 |
| Ohio (Columbus) | 1,310 kWh | 10,090 kWh | 10,392 kWh | 7.9 kW | $28,600 |
| Oklahoma (Oklahoma City) | 1,527 kWh | 11,760 kWh | 12,624 kWh | 8.3 kW | $29,800 |
| Oregon (Portland) | 1,128 kWh | 8,690 kWh | 10,188 kWh | 9.0 kW | $32,500 |
| Pennsylvania (Philadelphia) | 1,359 kWh | 10,460 kWh | 10,080 kWh | 7.4 kW | $26,700 |
| Rhode Island (Providence) | 1,294 kWh | 9,960 kWh | 6,720 kWh | 5.2 kW | $18,700 |
| South Carolina (Charleston) | 1,454 kWh | 11,200 kWh | 12,684 kWh | 8.7 kW | $31,400 |
| South Dakota (Sioux Falls) | 1,409 kWh | 10,850 kWh | 11,832 kWh | 8.4 kW | $30,200 |
| Tennessee (Nashville) | 1,338 kWh | 10,300 kWh | 14,376 kWh | 10.7 kW | $38,700 |
| Texas (Houston) | 1,421 kWh | 10,940 kWh | 13,236 kWh | 9.3 kW | $33,500 |
| Utah (Salt Lake City) | 1,484 kWh | 11,430 kWh | 9,336 kWh | 6.3 kW | $22,600 |
| Vermont (Burlington) | 1,222 kWh | 9,410 kWh | 7,092 kWh | 5.8 kW | $20,900 |
| Virginia (Richmond) | 1,344 kWh | 10,350 kWh | 12,612 kWh | 9.4 kW | $33,800 |
| Washington (Seattle) | 1,088 kWh | 8,380 kWh | 11,184 kWh | 10.3 kW | $37,000 |
| West Virginia (Charleston) | 1,232 kWh | 9,490 kWh | 12,636 kWh | 10.3 kW | $36,900 |
| Wisconsin (Milwaukee) | 1,334 kWh | 10,270 kWh | 7,968 kWh | 6.0 kW | $21,500 |
| Wyoming (Cheyenne) | 1,533 kWh | 11,800 kWh | 9,804 kWh | 6.4 kW | $23,000 |
What a solar system makes in each state and how big one has to be to match an average home's electricity use. Output is the yearly kilowatt-hours (kWh) from 1 kW of panels in the city shown, from NLR's PVWatts calculator: fixed, roof-mounted, south-facing panels with a 20° tilt and 14% system losses. Home use is the average monthly use of a residential customer, August 2025 to July 2026 (preliminary), times 12. The last column prices the system at the U.S. median of $3.60 per watt, before incentives. Sources: NLR PVWatts v8; U.S. EIA-861M; Lawrence Berkeley National Laboratory.
To size your own system, divide the kWh on your last 12 months of electric bills by the output per kW for your area. Our average electric bill by state guide shows what a kilowatt-hour costs where you live, which is what each kWh your panels make is worth when it replaces one you would have bought. If you plan to switch to electric heat or a heat pump water heater, the load rises and so does the system you need: see heat pump vs gas furnace cost, water heater replacement cost and winter heating costs.
What does this guide leave out?
- Your own quote. A median is a midpoint. Berkeley Lab's range for the middle 60% of 2025 systems runs from under $3 to nearly $5 per watt, so a fair quote can sit well away from $3.60.
- Loan interest and leases. The price data leaves out interest on a loan and has no price for leases and power purchase agreements, which were 40% of 2025 residential installs.
- Your roof. The output numbers assume south-facing panels at a 20° tilt with 14% system losses, in one large city per state. Shade, roof direction, tilt and panel type change the result, and a different city in the same state can differ.
- Incentives and export rules. State, local and utility programs and the way your utility pays for exported power are not in these numbers.
- Home use. The averages are for a typical customer in each state. A home with an electric car, electric heat or a pool uses more, and the system has to be larger.
- Maintenance and replacement. Berkeley Lab's data is the price at installation, not what a system costs to own over time.
The method behind every number on this site is in how we research costs. More guides on what it costs to run a home are in the Energy Bills section, and the average natural gas bill by state guide covers the other fuel most homes pay for. To see how many years a system takes to pay for itself in each state, read solar panel payback period by state.
Frequently asked questions
How much does it cost to install solar panels on a house?
The median home solar system installed in 2025 cost $3.60 per watt, according to Berkeley Lab. For the median 7.7 kW system, that is about $27,700 before incentives. Cash buyers paid about $3.00 per watt ($23,100) and loan-financed buyers about $4.50 ($34,700).
How much does a 10 kW solar system cost?
At Berkeley Lab's 2025 medians, about $30,000 paid in cash, $36,000 for all owner-owned systems and $45,000 with a loan, before incentives. With a battery, the median price per watt of $4.90 puts it near $49,000.
Is there still a federal tax credit for solar panels in 2026?
No. The IRS says the Residential Clean Energy Credit is not available for any property placed in service after December 31, 2025. State, local and utility incentives may still apply, so check them before you buy.
How much does solar cost with a battery?
Berkeley Lab's 2025 median was $4.90 per watt of solar capacity for systems with a battery, against $3.60 for solar alone. For a 7.7 kW system that is about $37,700. Most of the price records for these systems are from California.
Is it cheaper to pay cash or take out a loan for solar?
Cash was cheaper on the up-front price: $3.00 per watt against $4.50 for loan-financed systems in 2025. Berkeley Lab says loan fees rolled into the price may explain part of the gap, and its prices leave out the interest you pay over the loan.
How big a solar system does my house need?
Divide your yearly electricity use in kWh by the output per kW in your area. The average U.S. home uses about 10,440 kWh a year, which takes roughly 3.5 kW in California to 10.7 kW in Tennessee, based on the average use in each state. The median home system installed in 2025 was 7.7 kW.
Which state has the cheapest solar panels?
Among the 16 states with enough data to publish a median, Berkeley Lab's 2025 figures were lowest in Washington at $3.0 per watt, followed by Arizona and Florida at $3.1. New Mexico and North Carolina were highest at $4.1.
How much electricity does a solar panel system make?
It depends on where you live. One kilowatt of south-facing roof panels makes about 922 kWh a year in Anchorage and about 1,779 kWh in Albuquerque, using NLR's PVWatts calculator with a 20-degree tilt and 14% losses. A 7.7 kW system makes 7.7 times that.
Sources
- Lawrence Berkeley National Laboratory, "U.S. Distributed Solar and Storage, 2026 Data Update" (August 2026; slides 3, 4, 5, 6, 8, 9, 11, 35, 36, 37 and 38: installed prices for host-owned systems installed in 2025, system size, storage, ownership, price trends and state and installer differences; accessed October 20, 2026)
- Internal Revenue Service, Residential Clean Energy Credit (page last reviewed or updated July 4, 2026; credit not available for property placed in service after December 31, 2025; accessed October 20, 2026)
- National Laboratory of the Rockies (NLR, formerly the National Renewable Energy Laboratory), PVWatts Calculator, API version 8.5.0 (output of 1 kW of fixed, roof-mounted, south-facing panels at a 20-degree tilt with 14% losses, standard modules; accessed October 20, 2026)
- National Laboratory of the Rockies, PVWatts API v8 documentation (accessed October 20, 2026)
- U.S. Energy Information Administration, Electric Power Monthly and Form EIA-861M: residential sales and customers by state, August 2025 to July 2026, preliminary (used to compute average home use; accessed October 15, 2026)

Founder and editor, The Cost of Home
I lived in the United States for five years, and this site grew out of the question every household there keeps asking: what will this cost, and is it worth it? Every number here comes from a public source listed at the end of the article.