Owning a Home
Why Is Homeowners Insurance Going Up?
Quick answer
Homeowners insurance is going up because it costs more to rebuild a house, storms and fires are causing bigger claims, and insurers are passing that higher risk on to customers. Census data show the average amount owners pay rose about 50%, from $1,273 in 2019 to $1,911 in 2024, while consumer prices rose about 23%. Florida and Louisiana rose the most, about 70% each.
On this page
If your renewal notice came with a bigger number than last year, you are not imagining it. The question most people ask next is whether it is their house, their state or something happening to everyone. The data say mostly the last one: premiums have climbed in every region of the country, though by very different amounts.
I looked at this from two sides. The first is what owners say they pay, from the Census Bureau's American Community Survey, which I compared for 2019 and 2024. The second is what regulators, the Treasury and a property-data firm say is pushing the price. Where I could not read a report in full, I say so and credit the outlet that reported it.
How much has homeowners insurance gone up?
Using Census microdata, I took every owner who reports paying for fire, hazard or flood insurance and averaged the yearly amount. In 2019 that average was $1,273. In 2024 it was $1,911, an increase of 50%. The typical owner, the median, went from $1,000 to $1,500, the same 50%, though the survey rounds the amounts, so I rely more on the average.
Consumer prices overall rose about 23% over the same five years, using the Bureau of Labor Statistics' consumer price index. Put 2019 in 2024 dollars and the average was about $1,562, so after inflation the increase is about 22%. That is the part that comes from something other than general price growth.
Regulators see the same direction. The National Association of Insurance Commissioners (NAIC), which represents state insurance regulators, analyzed data from 715 insurers in August 2026 and found inflation-adjusted premiums per policy up between 18.3% and 43.3% since 2018, depending on the region, with the West highest. CNBC reported that the average premium in 2024 was $1,818 in the Southeast and $1,396 in the Northeast.
The Census figure and the NAIC figure are not the same measure. The NAIC counts premiums per policy as insurers report them, while the Census figure is what owners tell the survey they pay, and it can include flood coverage. For a premium comparison by state for one standard policy, see my guide to the average homeowners insurance cost by state. Across the whole country, the national margin of error in my calculation is under $10 in each year, so the 50% is not a rounding artifact.
What is pushing homeowners insurance costs up?
Four forces show up in the sources again and again. Which one matters most depends on where you live.
- The cost to rebuild. Cotality, a property-data company, tracks the reconstruction cost of homes across the country. In ResiClub's account of a presentation by its chief data officer, the pandemic housing boom overheated both home prices and material prices, and the resulting higher replacement costs are still feeding into premiums. CNBC, citing the Treasury Department, reported that replacement costs for property and casualty losses rose 45% on average from 2020 to 2023. When it costs more to rebuild, the coverage limit on your house and the price of the policy move up together.
- Bigger and more frequent claims. The NAIC found that claim frequency and severity generally increased between 2021 and 2024. Its homeowners report counts more than $940 billion in insured U.S. catastrophe losses from 2016 to 2025, in 2025 dollars. The Treasury's Federal Insurance Office found that in the fifth of ZIP codes with the highest expected losses from climate-related perils, premiums averaged $2,321 in 2018 to 2022, 82% more than in the fifth with the lowest, and the average claim was about $24,000 against about $19,000.
- More homes in harm's way. Cotality estimates that roughly 12% of U.S. housing stock sits in high-risk zones for wildfire, winter storm, hail and flooding, with $4.3 trillion in reconstruction cost, and expects that share to reach 20% by 2050. It also notes that one in six Americans now lives in a high wildfire risk area.
- Insurers pulling back. The rate at which insurers chose not to renew policies, counted per 1,000 in force, grew 96% in the Southeast and 216% in the West between 2018 and 2024, according to the NAIC. There were about 103 million homeowners policies in force in 2024. In my opinion, a nonrenewal matters for price as much as for access, because a new policy from a different company is a fresh quote at today's rates and not your old one.
There is also a quieter factor. According to CNBC, the NAIC report says it is "quite possible" that policyholders reduced their coverage to blunt rising premiums, which would likely show up in the data as a decrease or no change in premium. An insurance-law professor quoted by CNBC added that insurers have made policies less comprehensive over the years, for example by removing certain risks or lowering limits. So the same dollars can buy less protection than they did in 2019.
Which states have seen the biggest increases?
All of them rose, but not equally. Between 2019 and 2024 the average amount paid went up the most in Florida ($1,848 to $3,148, +70%) and Louisiana ($1,729 to $2,936, +70%), followed by Wyoming (+67%), Colorado (+67%) and Nebraska (+66%). By my count, 16 states rose 50% or more.
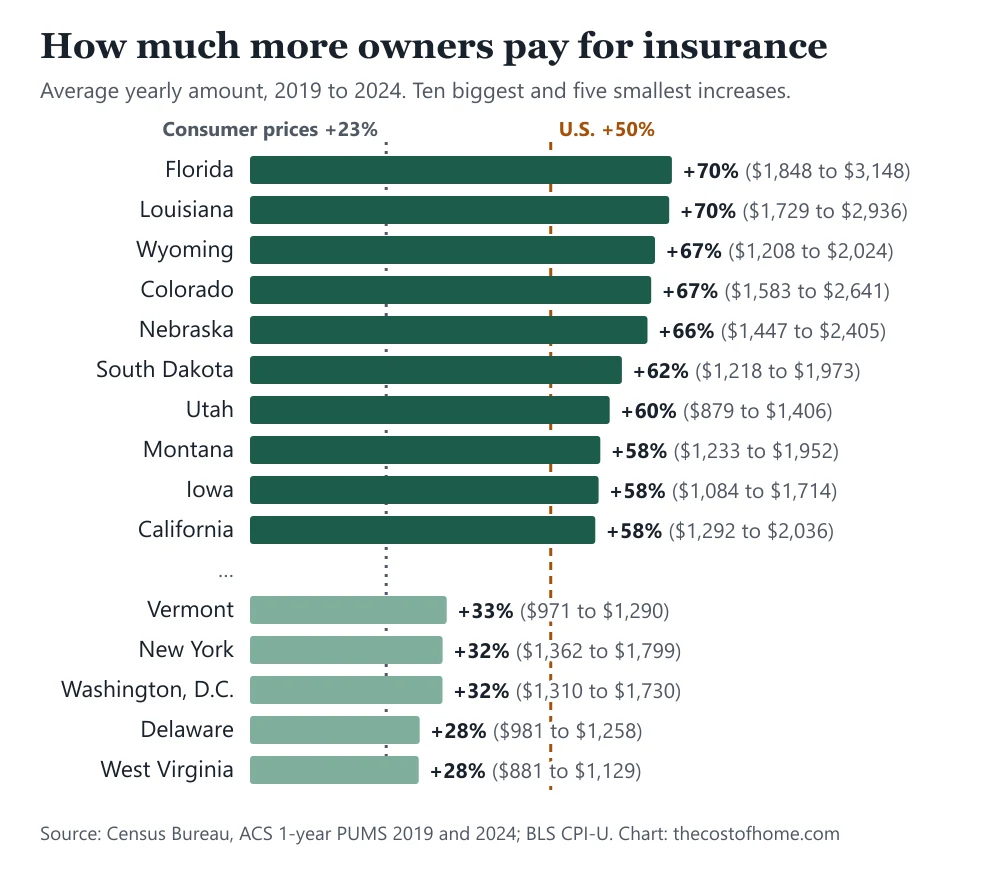
The smallest increases were in West Virginia and Delaware (+28% each), then Washington, D.C. and New York (+32% each) and Vermont (+33%). Even there, the average rose faster than consumer prices did, though for West Virginia the gap is within the margin of error, which is about 6 points.
The Census data do not say why a state rose more than another, so I would be careful with any simple story. The NAIC links wildfire to the West, hurricane exposure to the southeastern coast and tornado exposure to the central and southeastern parts of the country, and the expert CNBC quoted pointed out that hail causes a lot of property damage in states without much coastline. That fits some of the top of the list, but I did not test it, and it does not explain every state.
Here is every state. Alaska and Arkansas carry an asterisk because the survey sample is small there, with margins of error of about 53 and 24 points, so I do not rank them.
| State | 2019 | 2024 | Change |
|---|---|---|---|
| U.S. average | $1,273 | $1,911 | +50% |
| Alabama | $1,282 | $1,826 | +42% |
| Alaska | $1,240 | $1,695 | +37%* |
| Arizona | $934 | $1,416 | +52% |
| Arkansas | $1,172 | $1,752 | +50%* |
| California | $1,292 | $2,036 | +58% |
| Colorado | $1,583 | $2,641 | +67% |
| Connecticut | $1,581 | $2,165 | +37% |
| Delaware | $981 | $1,258 | +28% |
| District of Columbia | $1,310 | $1,730 | +32% |
| Florida | $1,848 | $3,148 | +70% |
| Georgia | $1,271 | $1,869 | +47% |
| Hawaii | $1,438 | $1,995 | +39% |
| Idaho | $891 | $1,365 | +53% |
| Illinois | $1,103 | $1,661 | +51% |
| Indiana | $1,079 | $1,525 | +41% |
| Iowa | $1,084 | $1,714 | +58% |
| Kansas | $1,544 | $2,239 | +45% |
| Kentucky | $1,155 | $1,653 | +43% |
| Louisiana | $1,729 | $2,936 | +70% |
| Maine | $922 | $1,297 | +41% |
| Maryland | $1,203 | $1,739 | +45% |
| Massachusetts | $1,478 | $2,028 | +37% |
| Michigan | $983 | $1,337 | +36% |
| Minnesota | $1,396 | $2,135 | +53% |
| Mississippi | $1,397 | $1,979 | +42% |
| Missouri | $1,329 | $1,895 | +43% |
| Montana | $1,233 | $1,952 | +58% |
| Nebraska | $1,447 | $2,405 | +66% |
| Nevada | $910 | $1,297 | +42% |
| New Hampshire | $1,022 | $1,382 | +35% |
| New Jersey | $1,281 | $1,719 | +34% |
| New Mexico | $1,096 | $1,612 | +47% |
| New York | $1,362 | $1,799 | +32% |
| North Carolina | $1,094 | $1,612 | +47% |
| North Dakota | $1,312 | $1,769 | +35% |
| Ohio | $960 | $1,372 | +43% |
| Oklahoma | $1,680 | $2,476 | +47% |
| Oregon | $923 | $1,417 | +53% |
| Pennsylvania | $967 | $1,320 | +37% |
| Rhode Island | $1,489 | $2,144 | +44% |
| South Carolina | $1,263 | $1,751 | +39% |
| South Dakota | $1,218 | $1,973 | +62% |
| Tennessee | $1,199 | $1,647 | +37% |
| Texas | $1,687 | $2,656 | +57% |
| Utah | $879 | $1,406 | +60% |
| Vermont | $971 | $1,290 | +33% |
| Virginia | $1,108 | $1,604 | +45% |
| Washington | $1,107 | $1,620 | +46% |
| West Virginia | $881 | $1,129 | +28% |
| Wisconsin | $911 | $1,317 | +45% |
| Wyoming | $1,208 | $2,024 | +67% |
Average yearly insurance paid by homeowners, 2019 and 2024, and the change. Owners who report paying only; the amount covers fire, hazard and flood insurance together. *Wide margin of error (more than 10 points), so I leave these states out of the rankings. Source: Census Bureau, ACS 1-year PUMS, my calculation.
These are averages for owners who report a payment, from a sample, and some owners pay flood or other coverage in the same line. Your own bill depends on your house, your coverage and your insurer, so use the table as a gauge of the direction in your state and not as a prediction for your policy. To see what the same kind of policy cost in each state, compare it with the NAIC premium table.
Will homeowners insurance keep going up in 2026 and 2027?
The signals point in two directions. Cotality said in November 2025 that it expects average U.S. homeowners premiums to rise another 8% in 2026 and another 8% in 2027, and that insurance had reached 9% of the typical homeowner's payment, the highest share on record. That is one company's projection, made before the year played out, and I treat it as a range and not a promise. CNBC also reported that premiums rose about 7% from the start of 2025, using a Bureau of Labor Statistics producer price index as a proxy that does not necessarily match what owners pay.
The other signal is reinsurance, the insurance that insurers buy to cover their largest losses. Guy Carpenter, a reinsurance broker, reported on May 28, 2026 that risk-adjusted property catastrophe reinsurance pricing for Florida insurers generally fell 15% to 20% at the June 1 renewals. It credited legal reforms passed in Florida in 2022, better loss results and a hurricane season in 2025 with no landfalling tropical storm, the first in a decade. Guy Carpenter said this supported "sustainable rate relief for policyholders," which is its view and not a guarantee that your bill will drop. It also warned that elevated Gulf and Caribbean sea temperatures still leave the potential for severe storms.
The NAIC adds that insurers' underwriting results improved in 2024 in all four of its regions. In my opinion, the honest summary is that the cost of rebuilding and the amount of risk have not gone away, but one large cost insurers pay is easing in at least one state. If you live in Florida, my guide to Florida's Amendment 3 covers the property tax side of the same ownership bill.
What can you do when your premium goes up?
- Ask how your coverage amount was set. The dwelling limit is tied to rebuilding costs and drives the price. If the number rose a lot, ask what changed and whether it matches what it would cost to rebuild your home.
- Line up quotes before you compare prices. Check that each one has the same dwelling limit, deductible and liability limit, otherwise the cheaper quote may simply cover less. My guide to the average cost by state lists what is left out of a standard policy.
- Ask about discounts. The NAIC notes that security systems and fire detection devices will often qualify a home for a discount, and Cotality says insurers in California use home-level resilience assessments to cut premiums by 20% or more for hardened homes. To see what a security system costs next to a discount, see my guide to home security system costs.
- Put the premium in your monthly budget. For most owners, insurance sits next to property tax as one of the two big fixed costs. My guides to property tax by state and to what it costs to own a home per month show both side by side, and what home maintenance costs per year covers the repairs that insurance usually does not pay for.
- Read a nonrenewal notice early. If an insurer tells you it will not renew, start comparing quotes the day the letter arrives, because the next policy will be priced at today's rates.
Frequently asked questions
Why is homeowners insurance going up so much?
Mainly because it costs more to rebuild a home, claims have become bigger and more frequent, more homes sit in areas exposed to storms, fires and hail, and insurers have raised prices and dropped some policies to cover that risk.
How much has homeowners insurance gone up since 2019?
Census data show owners who pay for insurance averaged $1,911 a year in 2024, up from $1,273 in 2019, an increase of about 50%. Consumer prices rose about 23% over the same period.
Which states have the biggest homeowners insurance increases?
Florida and Louisiana, at about 70% each between 2019 and 2024, followed by Wyoming, Colorado and Nebraska.
Will homeowners insurance go down in 2026 or 2027?
Nobody can promise that. Cotality projected in November 2025 increases of about 8% in each of 2026 and 2027, while Florida insurers saw reinsurance prices fall 15% to 20% at the June 1, 2026 renewals, which may ease some pressure there.
Why did my insurer not renew my homeowners policy?
Insurers decide not to renew when they think the risk outweighs the profit. From 2018 to 2024, the NAIC found, nonrenewals that insurers started grew by 96% in the Southeast and 216% in the West, counted per 1,000 policies.
Does homeowners insurance cover rising rebuilding costs?
Only up to the dwelling limit on your policy. Because the premium follows the amount of coverage, ask your insurer how the limit was set and whether it still matches what it would cost to rebuild your home.
Is the Census figure the same as the NAIC average premium?
No. The Census figure is what owners say they pay for fire, hazard and flood insurance, while the NAIC averages premiums per policy as insurers report them. Both show prices rising, but the numbers should not be compared directly.
Sources
- U.S. Census Bureau, American Community Survey 2024 1-year Public Use Microdata Sample, housing records, variable INSP (accessed November 8, 2026); 2019 file at the same address under /2019/
- U.S. Bureau of Labor Statistics, Consumer Price Index for All Urban Consumers, all items, annual averages 2019 and 2024 (series CUUR0000SA0)
- NAIC, "NAIC Releases First-of-Its-Kind National Analysis of Homeowners Insurance Market Trends" (August 5, 2026)
- CNBC, "Homeowners are paying much more for insurance and keeping coverage is getting harder" (August 6, 2026)
- NAIC, Dwelling Fire, Homeowners Owner-Occupied, and Homeowners Tenant and Condominium/Cooperative Unit Owners Insurance Report: Data for 2023 (July 2026), catastrophe losses and factors affecting premiums
- U.S. Department of the Treasury, "Homeowners Insurance Costs Rising, Availability Declining as Climate-Related Events Take Their Toll" (January 16, 2025)
- ResiClub, "Housing market is still passing through a home insurance shock, Cotality's chief data officer says" (November 20, 2025)
- Guy Carpenter, "Legal reforms, improved loss performance, and disciplined underwriting drive better June 1 reinsurance renewal outcomes for cedents" (May 28, 2026)

Founder and editor, The Cost of Home
I write and check every guide on this site myself, working from public data. The sources behind each number are listed at the end of the article, so you can check them too.