Owning a Home
How Much Does Flood Insurance Cost?
Quick answer
The average National Flood Insurance Program policy on a single-family home cost $1,345 a year, about $112 a month, in FEMA data for policies that started between October 2025 and September 2026. The typical policy cost $1,086. Hawaii and Connecticut averaged above $2,100, while Washington, D.C. and Alaska stayed under $500. Standard homeowners insurance does not cover flood damage.

On this page
- What is the average cost of flood insurance?
- How much does flood insurance cost in each state?
- Which states have the most and least expensive flood insurance?
- Why does flood insurance cost so different from house to house?
- What does a flood insurance policy cover?
- Why doesn't homeowners insurance cover a flood?
- How do you find out what your own flood insurance would cost?
- FAQ
- Sources
A flood can ruin a house that a standard homeowners policy will not repair. FEMA says most homeowners insurance does not cover flood damage, so anyone who wants that protection buys a separate policy, and most of those policies come from the federal National Flood Insurance Program (NFIP).
The numbers below come from FEMA's own open data. FEMA publishes a record for every NFIP policy, with the state, the map zone, the coverage and what the policyholder pays. I downloaded the records for single-family homes whose policies started between October 2025 and September 2026, 2,778,539 in all, and worked out the average and the median for the country and for each state. Private flood insurance is not in this data, so every price here is an NFIP price.
Cost means the full yearly price: the premium plus the federal policy fee, the reserve fund assessment and the surcharge that FEMA adds to every policy. This is the number on the bill, not only the premium line.
What is the average cost of flood insurance?
The average NFIP policy on a single-family home cost $1,345 a year, or about $112 a month. The median, the price of the policy in the middle of the line, was $1,086. The two differ because a minority of expensive policies pull the average up.
The spread is wide. 28% of the policies cost less than $800 a year, and 13% cost $2,000 or more. A small group, 3.3%, cost $4,000 or more.
| Yearly cost | Share of policies |
|---|---|
| Under $400 | 1.3% |
| $400 to $799 | 26.9% |
| $800 to $1,199 | 29.0% |
| $1,200 to $1,999 | 29.4% |
| $2,000 to $3,999 | 10.1% |
| $4,000 or more | 3.3% |
Share of single-family NFIP policies by yearly cost, policies starting October 2025 to September 2026. Source: FEMA OpenFEMA, NFIP policies; my calculations.
In my opinion, the median is the more honest number for planning, because it describes the policy a typical buyer holds. The average is the better number for budgeting if your house is in a high-risk spot, since that is where the expensive tail lives.
How much does flood insurance cost in each state?
Find your state in the table. Average and median are both yearly prices, and the last column shows how many policies stand behind each state's figures, which tells you how much weight to give a small state's average.
| State | Average | Median | Policies |
|---|---|---|---|
| U.S. total | $1,345 | $1,086 | 2,778,539 |
| Alabama | $1,450 | $1,260 | 23,046 |
| Alaska | $489 | $381 | 2,418 |
| Arizona | $1,146 | $995 | 14,818 |
| Arkansas | $1,208 | $1,023 | 7,621 |
| California | $1,243 | $1,080 | 124,387 |
| Colorado | $1,172 | $940 | 9,570 |
| Connecticut | $2,144 | $1,630 | 18,142 |
| Delaware | $1,305 | $1,173 | 14,783 |
| Florida | $1,506 | $1,055 | 875,791 |
| Georgia | $1,155 | $1,031 | 54,359 |
| Hawaii | $2,164 | $1,509 | 9,291 |
| Idaho | $1,233 | $1,090 | 3,422 |
| Illinois | $1,335 | $1,168 | 19,269 |
| Indiana | $1,126 | $964 | 12,513 |
| Iowa | $1,197 | $1,079 | 5,717 |
| Kansas | $1,180 | $1,064 | 4,879 |
| Kentucky | $1,501 | $1,226 | 11,436 |
| Louisiana | $1,245 | $1,162 | 320,217 |
| Maine | $1,587 | $1,209 | 5,844 |
| Maryland | $778 | $660 | 29,312 |
| Massachusetts | $1,710 | $1,429 | 29,543 |
| Michigan | $1,007 | $841 | 14,920 |
| Minnesota | $1,316 | $1,176 | 4,699 |
| Mississippi | $1,384 | $1,263 | 37,782 |
| Missouri | $1,346 | $1,121 | 9,505 |
| Montana | $1,242 | $1,012 | 2,771 |
| Nebraska | $1,064 | $946 | 5,331 |
| Nevada | $965 | $877 | 6,654 |
| New Hampshire | $1,745 | $1,402 | 3,469 |
| New Jersey | $1,590 | $1,350 | 97,157 |
| New Mexico | $1,378 | $1,080 | 9,557 |
| New York | $1,634 | $1,365 | 98,785 |
| North Carolina | $1,184 | $1,041 | 97,068 |
| North Dakota | $1,022 | $870 | 4,574 |
| Ohio | $1,107 | $923 | 16,615 |
| Oklahoma | $1,203 | $1,074 | 6,414 |
| Oregon | $1,330 | $1,158 | 13,809 |
| Pennsylvania | $1,511 | $1,253 | 28,342 |
| Rhode Island | $1,401 | $1,221 | 7,445 |
| South Carolina | $1,187 | $969 | 109,793 |
| South Dakota | $1,344 | $1,200 | 1,820 |
| Tennessee | $1,269 | $1,093 | 15,853 |
| Texas | $1,189 | $1,087 | 475,575 |
| Utah | $819 | $668 | 2,883 |
| Vermont | $1,667 | $1,363 | 2,191 |
| Virginia | $993 | $814 | 66,940 |
| Washington | $1,251 | $1,069 | 20,416 |
| Washington, D.C. | $443 | $393 | 1,150 |
| West Virginia | $1,703 | $1,402 | 6,123 |
| Wisconsin | $1,180 | $988 | 8,105 |
| Wyoming | $1,218 | $1,088 | 1,199 |
NFIP flood policies on single-family homes that started between October 2025 and September 2026, by state. Cost is what the policyholder pays in a year, including federal fees and surcharges. Policies = policy records in the data. Source: FEMA OpenFEMA, NFIP policies (data refreshed November 11, 2026); my calculations.
Treat a state number as a yardstick, not a quote. FEMA prices each property on its own, so two houses on the same street can pay very different amounts.
Which states have the most and least expensive flood insurance?
Among states and DC with at least 1,000 policies in the data, the five highest averages were Hawaii ($2,164), Connecticut ($2,144), New Hampshire ($1,745), Massachusetts ($1,710), West Virginia ($1,703). The five lowest were Washington, D.C. ($443), Alaska ($489), Maryland ($778), Utah ($819), Nevada ($965).
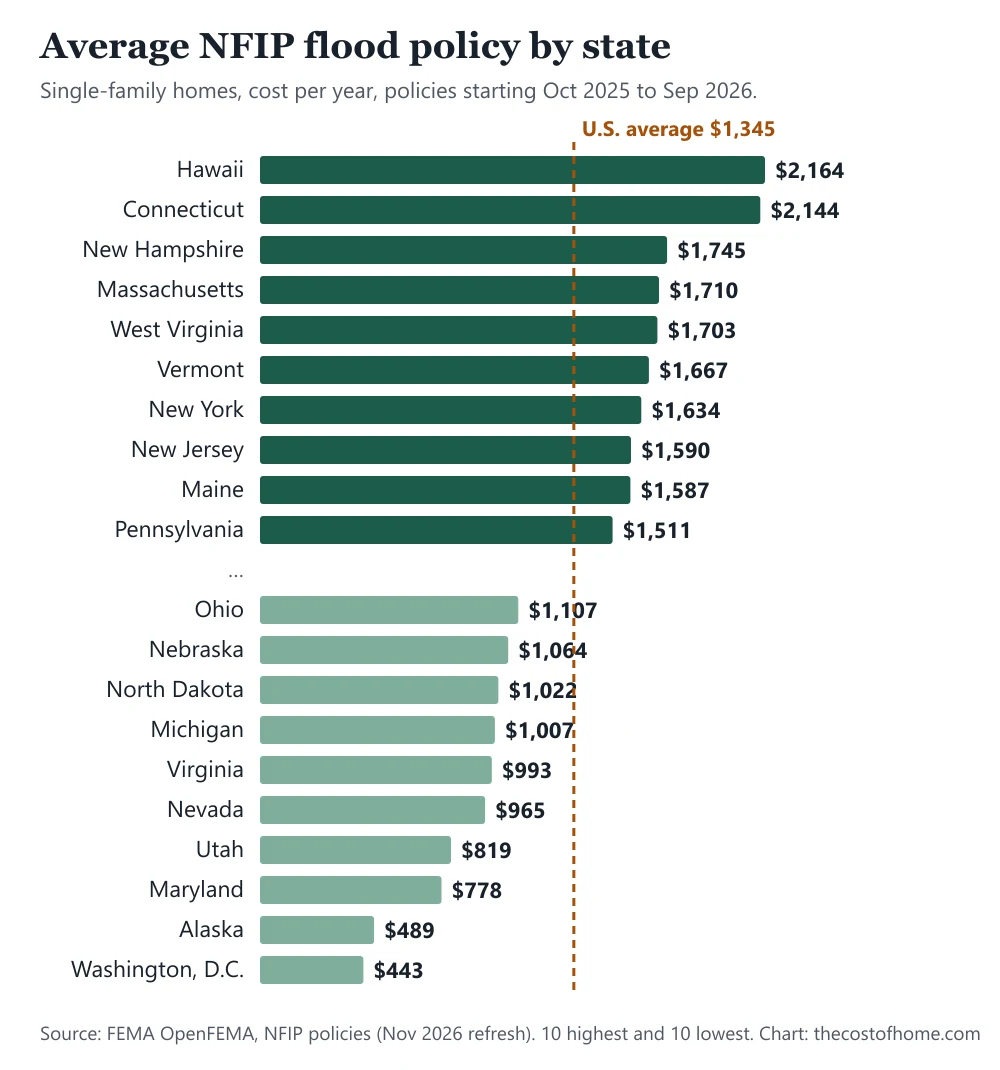
The most expensive states are not the ones with the most policies. Florida, Texas and Louisiana together hold 60% of the single-family policies in the data, but their averages sit close to the national figure: Florida $1,506, Louisiana $1,245 and Texas $1,189. Florida's median, $1,055, is much lower than its average, which means a smaller group of costly policies is doing the lifting there.
The data do not say why a state's prices come out where they do. They show what people pay, not the cause, and what each house is worth to rebuild and how often it floods also differ from state to state.
Why does flood insurance cost so different from house to house?
Since Risk Rating 2.0, which FEMA fully put in place on April 1, 2023, the NFIP prices each property by its own risk. FEMA says the approach looks at flood frequency, several flood types (river overflow, storm surge, coastal erosion and heavy rainfall), distance to a water source, and property traits such as elevation and the cost to rebuild. Before that, FEMA says, rates leaned on a property's elevation within a flood zone on a map, and did not account for what it cost to rebuild the home.
Two things stayed the same, according to FEMA. Rate increases are limited by law, so most rates cannot rise more than 18% a year. And communities in the Community Rating System can earn NFIP discounts of 5% to 45%.
The zone on the map still shows up in the prices people pay:
| Group | Policies | Average | Median |
|---|---|---|---|
| High-risk zones | 57% | $1,622 | $1,231 |
| Outside them | 43% | $977 | $968 |
| Primary home | 83% | $1,271 | $1,074 |
| Not primary | 17% | $1,713 | $1,322 |
Same data, split two ways. High-risk zones are FEMA map zones that start with A or V; "outside" is every other zone, mostly moderate and low risk. Primary residence is the owner's main home. Source: FEMA OpenFEMA, NFIP policies; my calculations.
Policies in the high-risk zones averaged $1,622, about $645 more than policies outside them. Homes that are not the owner's main residence averaged $1,713, against $1,271 for primary homes. Being outside a high-risk zone does not mean being safe: FEMA says almost one-third of NFIP claims from 2014 to 2024 came from low- and moderate-risk areas.
What does a flood insurance policy cover?
A standard NFIP policy can cover up to $250,000 for the house and $100,000 for the belongings inside, according to FEMA's October 15, 2026 release. Both are separate amounts, and contents coverage is available to homeowners and renters. The NFIP also pays without a presidential disaster declaration, which federal disaster assistance requires.
The cap matters when you read the prices above. 76% of the single-family policies in the data carry the full $250,000 of building coverage. If rebuilding your house would cost more than that, the policy stops at $250,000 and the rest is yours to cover.
FEMA also warns about timing. There is usually a 30-day waiting period before an NFIP policy takes effect, unless a government-backed lender requires the coverage or the purchase follows a flood map change. Buying after a storm is forecast is too late.
Why doesn't homeowners insurance cover a flood?
A standard homeowners policy covers the house against all risks except the ones it excludes, and flood is one of them. FEMA says plainly that most homeowners insurance does not cover flood damage and that flood insurance is a separate policy. I cover what the standard policy costs in my guide to average homeowners insurance by state and what is pushing it up in why homeowners insurance is going up.
For a rough idea of the two bills together, the average homeowners policy in the NAIC's latest data was $1,737 a year, and the average flood policy here is $1,345. Added together that is about $3,100 a year. The two come from different years and different groups of homes, so it is a rough guide and not a quote.
If you are budgeting for a house, put flood insurance next to the other recurring costs: property tax by state, what home maintenance costs per year and the full picture in my guide to what it costs to own a home per month.
How do you find out what your own flood insurance would cost?
- Start with your state's median. Use the table as a starting point, then expect your house to land above or below it.
- Ask for a quote, not an estimate. FEMA says NFIP policyholders can contact their insurance company or agent. The NFIP prices the property itself, so the quote is the only number that counts.
- Check the coverage amounts. Compare the building limit, the contents limit and the deductible, because a lower price can simply be less coverage.
- Plan for the waiting period. Buy at least 30 days before you want protection, unless a lender requires the policy at closing.
- Ask about discounts. If your community takes part in the Community Rating System, FEMA says it can earn NFIP discounts of 5% to 45%.
Frequently asked questions
What is the average cost of flood insurance?
About $1,345 a year, or $112 a month, for an NFIP policy on a single-family home that started between October 2025 and September 2026. The median was $1,086.
Which state has the most expensive flood insurance?
Among states and DC with at least 1,000 policies in the data, Hawaii had the highest average at $2,164 a year, followed by Connecticut at $2,144.
Which state has the cheapest flood insurance?
Washington, D.C. had the lowest average at $443 a year, then Alaska at $489 and Maryland at $778.
Does homeowners insurance cover flood damage?
Usually not. FEMA says most homeowners insurance does not cover flood damage, and flood insurance is a separate policy that can cover the building, the belongings or both.
How much coverage can you get from the NFIP?
Up to $250,000 for a residential building and $100,000 for personal belongings, according to FEMA's October 15, 2026 release.
Is there a waiting period for flood insurance?
Usually 30 days before an NFIP policy takes effect, FEMA says, unless a government-backed lender requires the coverage or the purchase is tied to a flood map change.
Do I need flood insurance if I am outside a high-risk zone?
It is your decision unless a lender requires it. FEMA says almost one-third of NFIP claims from 2014 to 2024 came from low- and moderate-risk areas, and policies outside high-risk zones averaged $977 a year in this data.
Sources
- FEMA, OpenFEMA dataset "NFIP Redacted Policies - v3" (data refreshed November 11, 2026; downloaded November 18, 2026 through the OpenFEMA API; single-family homes, policies effective October 2025 to September 2026)
- FEMA, "NFIP's Pricing Approach" (Risk Rating 2.0) (accessed November 18, 2026)
- FEMA, "Most Homeowners Insurance Does Not Cover Flood Damage" (October 15, 2026)
- FEMA, Flood Insurance (waiting period and coverage basics, accessed November 18, 2026)
- National Association of Insurance Commissioners, Homeowners Insurance Report: Data for 2023 (July 2026), used for the average homeowners premium

Founder and editor, The Cost of Home
I write and check every guide on this site myself, working from public data. The sources behind each number are listed at the end of the article, so you can check them too.