Energy Bills
Do Solar Panels Work in Winter? Output in Cold, Cloudy Months
Quick answer
Yes. Solar panels work in winter and make less power than in summer because days are shorter and the sun is lower, not because it is cold. For a typical 7.7 kW system, December output runs from about 68% of June's in Phoenix to about 25% in Seattle, and Anchorage makes close to nothing. Snow trims the year by 0% to 12% in the cities modeled here.
On this page
- Do solar panels work in winter?
- How much less power do solar panels make in winter?
- Why do panels make less power in winter?
- How much does snow cut solar output?
- Does the tilt of the panels change the snow loss?
- What does winter solar mean for your electric bill?
- Does winter output change how long solar takes to pay back?
- How can you estimate winter output for your own roof?
- What does this estimate miss?
- FAQ
- Sources
Winter is when people ask whether solar was worth it, because the days are short, the sky is gray and the roof may be white. The short answer is yes, panels still make power in winter. The longer answer is that they make a lot less in some places and only a little less in others, and that is the part that decides what the system does for a January bill.
This guide uses public data to show it. It takes the monthly output of a typical home system in ten cities, from Phoenix to Anchorage, adds the yearly loss from snow that federal researchers modeled for the same places, and then sets January output against what an average home in each state uses that month.
Do solar panels work in winter?
Yes. Panels turn light into power, and winter still has light. What changes is how much. The U.S. Department of Energy's Federal Energy Management Program (FEMP) puts it plainly on its winter-weather page: “PV modules operate more efficiently in colder weather, as temperatures above 77°F cause decreases in voltage.” That is 25 °C (77 °F), so a cold panel is not the problem.
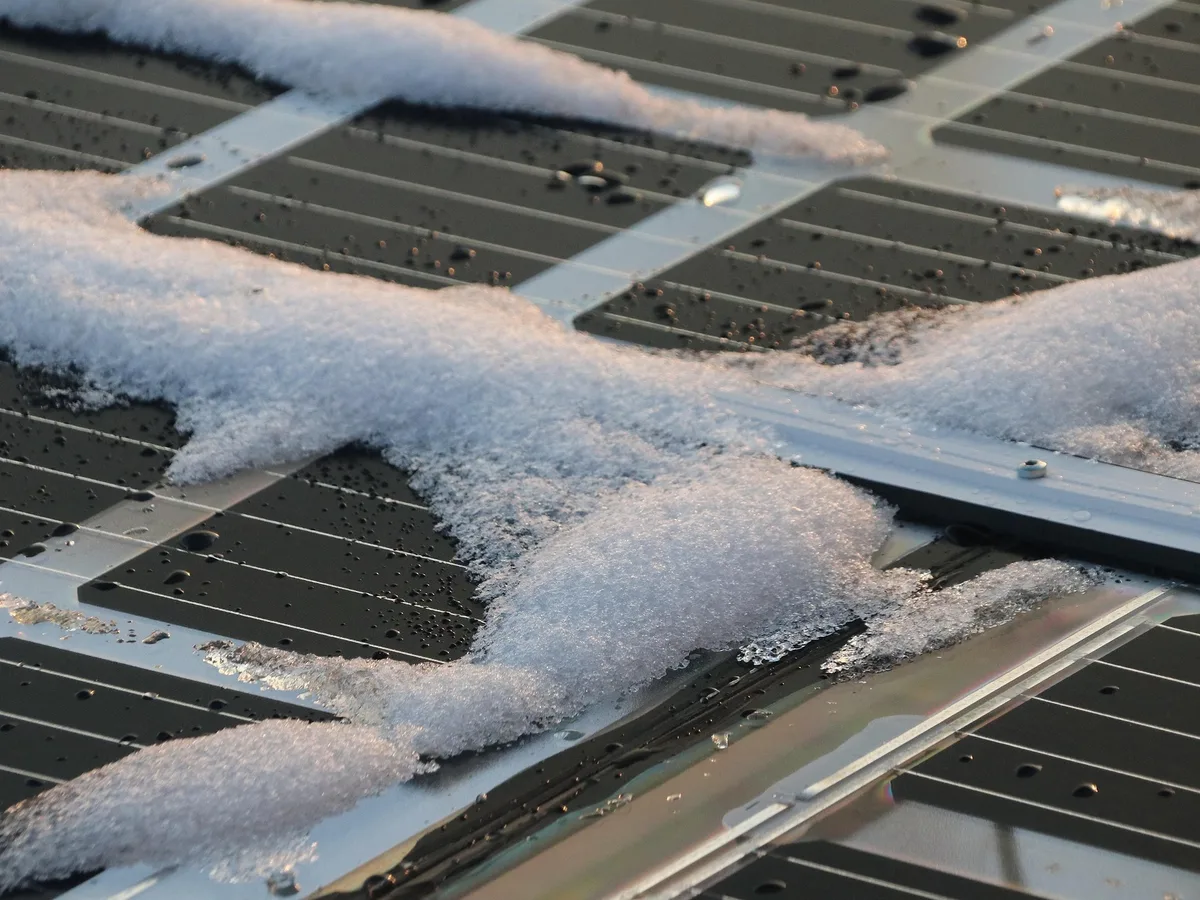
The same page adds that winter can still “limit power production,” mostly because of ice and snow on the system. In practice three things cut winter output: shorter days, a lower sun and snow cover. The next sections put numbers on each.
How much less power do solar panels make in winter?
It depends on how far north you are more than on how cold it gets. In Phoenix, a 7.7 kW system makes about 898 kWh in December, 68% of its June output of 1,330 kWh. In New York City it makes 489 kWh in December, 46% of June. In Seattle the same system makes 255 kWh, 25% of June, and in Anchorage, at 61 degrees north, only 60 kWh, about 6% of June.
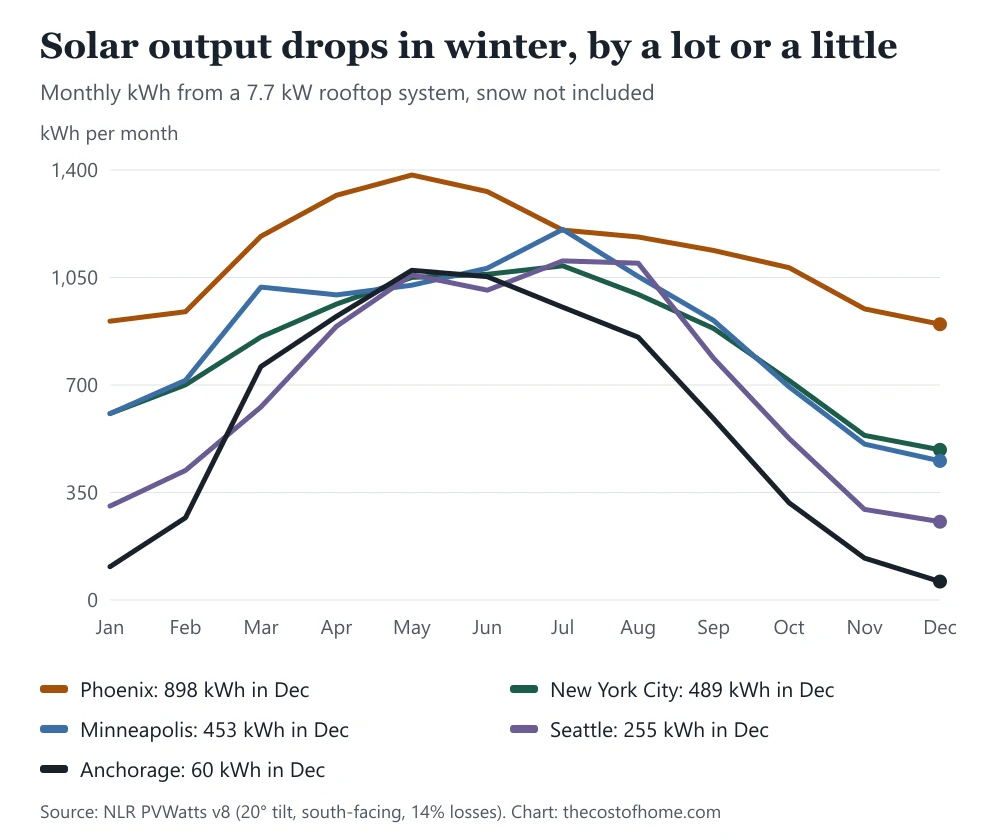
Another way to see it is how much of the year's power arrives in the three winter months. An even split would be 25%. In Phoenix it is 20%, in New York City 18%, in Seattle 12% and in Anchorage 6%.
| City | Dec | Jun | Dec vs Jun | Dec-Feb share |
|---|---|---|---|---|
| Phoenix, AZ | 898 | 1,330 | 68% | 20% |
| Los Angeles, CA | 772 | 1,254 | 62% | 19% |
| Houston, TX | 662 | 1,037 | 64% | 19% |
| New York City, NY | 489 | 1,060 | 46% | 18% |
| Boston, MA | 454 | 986 | 46% | 18% |
| Chicago, IL | 441 | 1,119 | 39% | 16% |
| Minneapolis, MN | 453 | 1,080 | 42% | 17% |
| Fargo, ND | 416 | 1,131 | 37% | 15% |
| Seattle, WA | 255 | 1,009 | 25% | 12% |
| Anchorage, AK | 60 | 1,053 | 6% | 6% |
Monthly output of a 7.7 kW rooftop solar system, which is the U.S. median size for 2025, in ten cities, in kilowatt-hours (kWh). “Dec vs Jun” is December output as a share of June output. “Dec-Feb share” is how much of the year's output comes in December, January and February; an even split would be 25%. Output is from NLR's PVWatts calculator for fixed, roof-mounted, south-facing panels at a 20° tilt with 14% system losses, and does not include snow. Sources: NLR PVWatts v8; Lawrence Berkeley National Laboratory (system size).
The pattern is steady: the southern cities lose about a third of their output between June and December, the northern tier of the lower 48 loses more than half, and the Pacific Northwest and Alaska lose most of it.
Why do panels make less power in winter?
Mostly because there is less sun to catch. Days are shorter, the sun sits lower in the sky and the light passes through more air, and on a cloudy day less of it reaches the panel. Seattle shows how those add up. It is gray and far north, and its December output is 28% of Phoenix's. The monthly numbers cannot separate clouds from day length, so I would not read that gap as only a cloud effect.
The cold itself is the one winter factor that helps. Because PVWatts reports module temperature hour by hour, the model takes it into account, so the cold-weather boost is already inside the numbers above. It is not large enough to make up for the lost daylight. What stands out in the data is how little the thermometer matters next to latitude: Phoenix and Houston both keep about two-thirds of their June output in December, while Chicago, which is far colder, keeps 39%, and Seattle, which is milder, keeps only 25%.
How much does snow cut solar output?
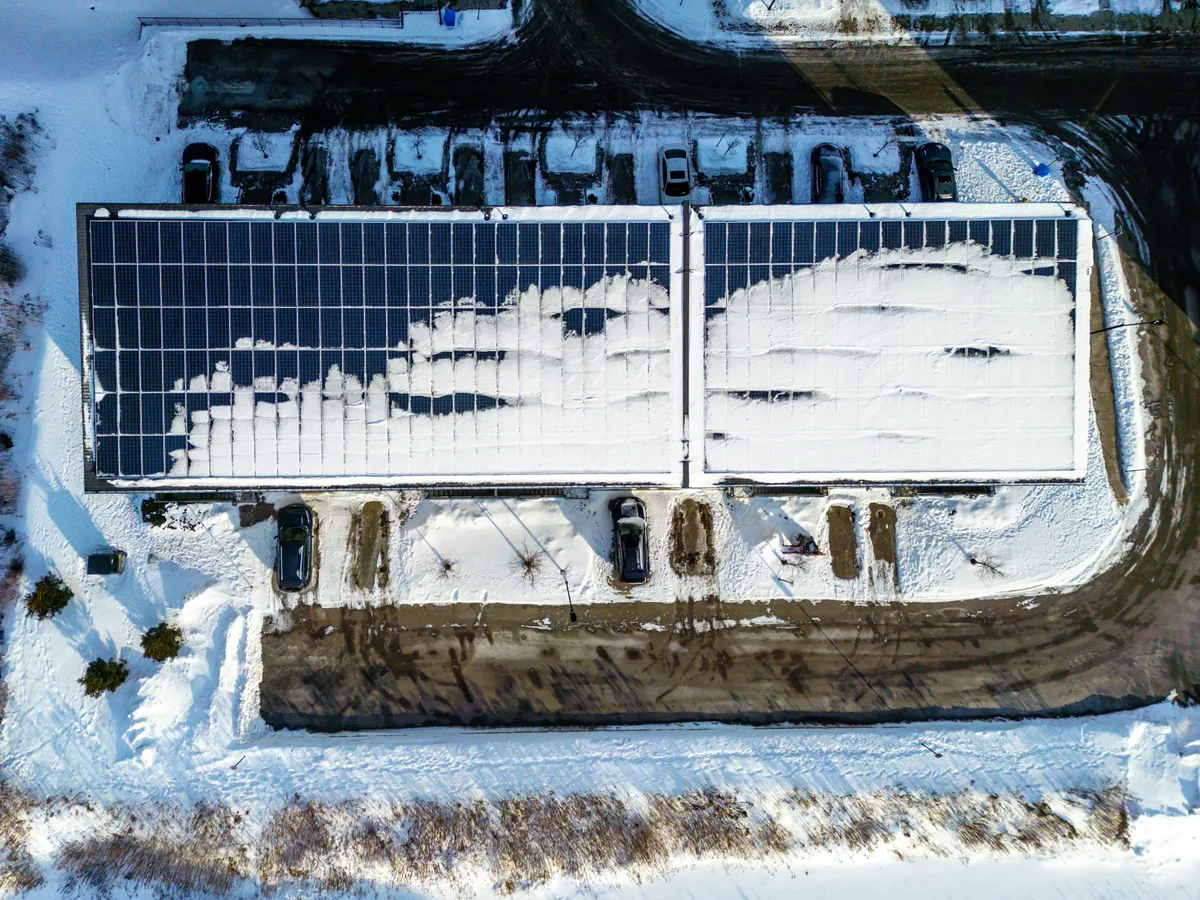
For most of the country, not much over a year. The National Laboratory of the Rockies (NLR, formerly NREL) modeled snow losses for fixed-tilt systems across the United States, using 30 years of historical weather. It found annual losses from 0% to about 16% in the lower 48, with the highest in Minnesota and Michigan, and as high as nearly 40% at one site in northern Alaska. Its snowiest zone runs from the Northeast through the Great Lakes and the Midwest to the northern Rocky Mountains.
For the cities in this guide, the modeled loss at a 20° tilt runs from 0% in Phoenix, Los Angeles and Houston to 12.2% in Fargo. Minneapolis is at 10.7%, Chicago 6.1%, Anchorage 7.1%, Boston 2.8% and New York City 1.9%. Seattle, which is gray but gets little snow, is at just 0.3%.
| City | Snow loss | Year, no snow | With snow |
|---|---|---|---|
| Fargo, ND | 12.2% | 9,962 | 8,747 |
| Minneapolis, MN | 10.7% | 10,263 | 9,165 |
| Anchorage, AK | 7.1% | 7,097 | 6,593 |
| Chicago, IL | 6.1% | 10,075 | 9,460 |
| Boston, MA | 2.8% | 10,025 | 9,745 |
| New York City, NY | 1.9% | 9,944 | 9,755 |
| Seattle, WA | 0.3% | 8,378 | 8,352 |
| Phoenix, AZ | 0.0% | 13,514 | 13,514 |
| Los Angeles, CA | 0.0% | 12,914 | 12,914 |
| Houston, TX | 0.0% | 10,945 | 10,945 |
Average yearly loss from snow cover for a fixed solar system tilted 20°, as modeled by the National Laboratory of the Rockies (NLR, formerly NREL) from 30 years of historical weather, next to the year's output from the previous table (without snow). “With snow” is that output reduced by the modeled loss; it is a simple estimate, not a forecast for any one winter. Sources: NREL/NLR technical report NREL/TP-6A20-68705 (Table A-1); NLR PVWatts v8.
The NLR authors say these values are a starting point: they “may not be representative of any particular year” and do not account for local microclimates. A hilly or lake-effect site can lose more than a nearby flat one. The DOE says most snow “will melt quickly off PV systems or be blown off by wind,”.
Does the tilt of the panels change the snow loss?
Yes, and it is one of the few things you can influence. The DOE's FEMP page says higher tilt angles let snow shed more quickly and that the steeper the angle, the better the snow sheds, up to 60 degrees, with “significant gains” around 30 to 35 degrees, which it notes is steeper than a typical roof. A steeper tilt also adds wind load and cost, so installers trade it against production. Most home systems follow the pitch of the roof.
The same page covers strength. Heavy snow can warp or even break a module, a typical module is rated for 2,400 pascals of load, and for places at risk of heavy snow accumulation it recommends modules certified to at least 5,000 pascals. If you live where the snow is deep, that rating is worth asking about when you compare quotes. For the price side, see how much solar panels cost.
What does winter solar mean for your electric bill?
In the sunny states, January is still a good month. A 7.7 kW system in Phoenix makes 908 kWh in January, more than the 755 kWh the average Arizona home used that month, and in Los Angeles it makes 846 against 604 for the average California home. In the north the picture changes. A Minneapolis system makes 607 kWh against 891 used in Minnesota, covering about 68%, and in Seattle it covers about 24%.
| City | Jan use | Jan solar | Covers | Worth |
|---|---|---|---|---|
| Phoenix, AZ | 755 | 908 | 120% | $140 |
| Los Angeles, CA | 604 | 846 | 140% | $279 |
| Houston, TX | 1,085 | 715 | 66% | $114 |
| New York City, NY | 674 | 607 | 90% | $172 |
| Boston, MA | 717 | 624 | 87% | $190 |
| Chicago, IL | 812 | 506 | 62% | $95 |
| Minneapolis, MN | 891 | 607 | 68% | $98 |
| Fargo, ND | 1,578 | 499 | 32% | $61 |
| Seattle, WA | 1,269 | 306 | 24% | $43 |
| Anchorage, AK | 825 | 109 | 13% | $29 |
What a 7.7 kW system makes in January against what the average home in the state used that month. “Jan use” is the average kilowatt-hours per residential customer in the state in January 2026 (preliminary). “Jan solar” is the system's January output (no snow). “Covers” is Jan solar divided by Jan use. “Worth” is Jan solar valued at the state's average residential price per kWh, August 2025 to July 2026. An average home may use more or less than the 7.7 kW system is sized for. Sources: U.S. EIA-861M; NLR PVWatts v8.
Two things stand out. First, homes in the coldest states use more power in January, and where more homes heat with electricity that is likely part of the reason. North Dakota's average January use of 1,578 kWh is more than double Arizona's, which is why a system there covers only about 32% of the month. For that side, see electric bill winter vs summer by state. Second, the dollar value of January solar differs widely, from about $29 in Alaska to $279 in California, because the price of a kilowatt-hour differs as much as the sunshine does.
My read is that a cold-state buyer should judge solar by the January column, not by the July one. A system can cover the whole summer bill and still leave a heating-season bill that looks much like the old one. That is not a reason to skip solar, since the yearly total is what pays the system back, but it does set the right expectation for the winter statement.
Does winter output change how long solar takes to pay back?
It is already inside the payback numbers. The payback period by state guide uses each city's full-year output, so the weak winter months and the strong summer ones are both counted. What it does not count is snow, which the table above puts at 0% to 12% of the year in these cities, and it assumes a retail-rate credit for every kilowatt-hour. If your utility pays less for the summer surplus you send to the grid, the way you use that power across the seasons matters more, which is why that guide has a section on export rules.
How can you estimate winter output for your own roof?
- Ask for a month-by-month estimate. A quote that shows only a yearly number hides the winter. Ask the installer for expected kWh per month, and what tilt, direction and shade it assumes.
- Run the free calculator. NLR's PVWatts calculator gives monthly output for any address, using the same model as this guide. Enter your roof's tilt and direction to see December.
- Compare it with your January bill. Your January kilowatt-hours are on the bill; the rate and the use are explained in how to read your electric bill. Divide the estimate for January by that number to see how much of the month it covers.
- If you get heavy snow, ask about the module's snow-load rating. The DOE suggests at least 5,000 pascals for sites at risk of heavy snow accumulation.
A home that adds an electric car or a heat pump will use more in winter than the average home in the table. See heat pump vs gas furnace cost and winter heating costs for 2026-27 for the heating side.
What does this estimate miss?
- One city per state. Each result is for one large city. Your town, your roof and your shade can differ.
- Snow is a yearly average. The snow losses are 30-year averages from a 2017 model and a simple multiplication, not a forecast. A heavy winter can lose more, and a mild one less. The report also warns that local conditions can differ.
- No monthly snow figures. Snow loss lands mostly in winter, so winter output in the snowy cities is lower than the monthly table shows.
- Average homes, not yours. January use is the state average per customer. Your home may use half or double that.
- Price and export rules. The value column uses the average price. The savings for each kilowatt-hour can be lower, and utilities differ in how they credit power sent to the grid.
The page how I research costs explains where each source comes from. If you want the other half of the picture, the average electric bill by state shows what a kilowatt-hour costs where you live, and the Energy Bills section has the rest of the series.
Frequently asked questions
Do solar panels work in winter?
Yes. They make power whenever there is light, and the DOE says panels operate more efficiently in cold weather. They make less in winter because days are shorter and the sun is lower. A 7.7 kW system makes about 898 kWh in December in Phoenix and about 255 kWh in Seattle.
How much less power do solar panels make in winter?
In December, a typical system makes about 68% of its June output in Phoenix, 46% in New York City, 42% in Minneapolis and 25% in Seattle, according to NLR's PVWatts calculator. In Anchorage it is about 6%.
Do solar panels work when it is cloudy or snowing?
They still make some power in clouds, but less than in full sun. Heavy snow on the panels can stop output until it melts or slides off. The DOE says most snow melts quickly off a system or is blown off by wind, and the heavier the snow, the greater the risk to the system.
How much power do solar panels lose to snow?
Over a year, NLR modeled losses from 0% to about 16% for fixed-tilt systems in the lower 48 states, highest in Minnesota and Michigan, and up to nearly 40% at one site in northern Alaska. For a 20-degree tilt, the cities in this guide range from 0% in Phoenix to 12.2% in Fargo.
Do solar panels work better in cold weather?
Each hour of sun can make a little more power in the cold. The DOE says modules operate more efficiently in colder weather, because temperatures above 25 °C (77 °F) cause decreases in voltage. But winter has fewer hours of weaker sun, so the total is still lower than in summer.
Should I clear snow off my solar panels?
The DOE says most snow melts quickly or blows off on its own. Its advice before a severe storm is to remove snow only if there is a substantial accumulation and a risk of overloading, gently, with a broom and not a shovel. If you are unsure, ask your installer first.
Is solar worth it in a cold state?
It can be. The payback depends more on the price of electricity than on the sun, and many cold states have high prices. See the solar payback by state guide for the numbers. Expect a winter bill that is only partly covered by the panels.
Sources
- U.S. Department of Energy, Federal Energy Management Program, "Solar Photovoltaic Hardening for Resilience: Winter Weather" (page modified May 11, 2026; cold-weather efficiency, snow shedding, tilt angle and module snow-load ratings; accessed November 4, 2026)
- Keith, J. and Ryberg, D., "Integration, Validation, and Application of a PV Snow Coverage Model in SAM," NREL/TP-6A20-68705, National Renewable Energy Laboratory (now National Laboratory of the Rockies), 2017 (annual snow losses for fixed-tilt systems, Table A-1 by city; accessed November 4, 2026)
- National Laboratory of the Rockies (NLR), PVWatts Calculator, API version 8 (monthly output of 1 kW of fixed, roof-mounted, south-facing panels at a 20-degree tilt with 14% losses, standard modules; accessed November 4, 2026)
- U.S. Energy Information Administration, Form EIA-861M: residential sales and revenue by state, January 2026 use and August 2025 to July 2026 average price, preliminary (accessed October 15, 2026)
- Lawrence Berkeley National Laboratory, "U.S. Distributed Solar and Storage, 2026 Data Update" (August 2026; median system size of 7.7 kW installed in 2025; accessed October 20, 2026)

Founder and editor, The Cost of Home
I write and check every guide on this site myself, working from public data. The sources behind each number are listed at the end of the article, so you can check them too.