Energy Bills
Electric Bill in Winter vs Summer: How Much It Changes by State
Quick answer
The average U.S. home paid about $175 for electricity in January 2026 and $212 in July, roughly $37 (21%) more in summer. That average hides a split: July was clearly the costlier month in 27 states and D.C., led by Arizona (+$145), January was in 10, led by Alaska and West Virginia, and 13 had no clear winner.

On this page
- How much higher is the electric bill in summer than in winter?
- What is the electric bill in winter and summer in each state?
- Which states have the biggest summer jump?
- Which states pay more for electricity in winter?
- Which states have about the same bill in winter and summer?
- How can you plan around the swing?
- How was this calculated?
- FAQ
- Sources
Most people expect the electric bill to jump in summer, when the air conditioner runs, and to rise a little in winter. For the country as a whole that is what happens. For your state it may not be: in some of them the winter bill is the bigger one, and in others the gap is huge.
The figures below come from the U.S. Energy Information Administration (EIA), which collects monthly revenue and customer counts from every electric utility and power supplier. The average bill is residential revenue divided by the number of residential customers for the month, which is the same method as in our average electric bill by state guide. January and July 2026 are the latest winter and summer months with complete data, and the EIA still marks both as preliminary. Where it helps, January and July 2025 are shown next to them to check whether a pattern holds from one year to the next.
How much higher is the electric bill in summer than in winter?
For the U.S. average, about $37 higher, or 21%. The average home used 1,003 kWh in January 2026 and 1,160 kWh in July, and paid $175.11 and $212.44. The year before was close: $169.55 in January 2025 and $203.57 in July 2025, a gap of $34.
| Year | January bill | July bill | Difference | January use | July use |
|---|---|---|---|---|---|
| 2026 | $175.11 | $212.44 | +$37 | 1,003 kWh | 1,160 kWh |
| 2025 | $169.55 | $203.57 | +$34 | 1,064 kWh | 1,166 kWh |
U.S. average residential electric bill and use in January and July, 2025 and 2026. Source: U.S. EIA, Form EIA-861M (2026 data preliminary).
Neither month is the cheapest of the year. In our month-by-month look at the U.S. bill, the lowest national averages came in November 2025 ($125) and April 2026 ($128), the in-between months when homes use little heating or cooling.
What is the electric bill in winter and summer in each state?
Find your state in the table. The last column shows which month was higher; the difference column is July minus January, so a minus sign means January cost more.
| State | January 2026 | July 2026 | July minus January | Higher month |
|---|---|---|---|---|
| U.S. average | $175.11 | $212.44 | +$37 | July |
| Alabama | $216.82 | $248.69 | +$32 | July |
| Alaska | $210.54 | $141.29 | -$69 | January |
| Arizona | $117.87 | $263.16 | +$145 | July |
| Arkansas | $152.37 | $201.53 | +$49 | July |
| California | $182.84 | $191.76 | +$9 | Depends on the year |
| Colorado | $112.53 | $174.06 | +$62 | July |
| Connecticut | $245.30 | $221.84 | -$23 | Depends on the year |
| Delaware | $192.83 | $197.81 | +$5 | Depends on the year |
| District of Columbia | $188.00 | $208.59 | +$21 | July |
| Florida | $154.74 | $221.97 | +$67 | July |
| Georgia | $180.47 | $240.38 | +$60 | July |
| Hawaii | $222.31 | $262.17 | +$40 | Depends on the year |
| Idaho | $142.79 | $152.66 | +$10 | Depends on the year |
| Illinois | $132.88 | $193.07 | +$60 | July |
| Indiana | $192.14 | $204.97 | +$13 | July |
| Iowa | $138.50 | $193.22 | +$55 | July |
| Kansas | $143.52 | $208.36 | +$65 | July |
| Kentucky | $208.92 | $192.52 | -$16 | Depends on the year |
| Louisiana | $151.48 | $212.34 | +$61 | July |
| Maine | $181.28 | $142.80 | -$38 | January |
| Maryland | $271.43 | $253.42 | -$18 | January |
| Massachusetts | $223.37 | $224.86 | +$1 | Depends on the year |
| Michigan | $139.81 | $210.65 | +$71 | July |
| Minnesota | $133.46 | $169.45 | +$36 | July |
| Mississippi | $180.55 | $228.20 | +$48 | July |
| Missouri | $158.65 | $226.03 | +$67 | July |
| Montana | $141.44 | $133.30 | -$8 | Depends on the year |
| Nebraska | $135.64 | $172.11 | +$36 | July |
| Nevada | $96.84 | $207.12 | +$110 | July |
| New Hampshire | $213.46 | $206.96 | -$6 | Depends on the year |
| New Jersey | $174.15 | $261.02 | +$87 | July |
| New Mexico | $98.87 | $151.51 | +$53 | July |
| New York | $191.06 | $234.29 | +$43 | July |
| North Carolina | $184.86 | $202.80 | +$18 | Depends on the year |
| North Dakota | $172.38 | $144.45 | -$28 | January |
| Ohio | $195.23 | $223.76 | +$29 | July |
| Oklahoma | $152.05 | $229.36 | +$77 | July |
| Oregon | $166.88 | $137.17 | -$30 | January |
| Pennsylvania | $229.03 | $221.46 | -$8 | Depends on the year |
| Rhode Island | $190.80 | $216.81 | +$26 | Depends on the year |
| South Carolina | $197.59 | $232.00 | +$34 | July |
| South Dakota | $172.51 | $176.10 | +$4 | Depends on the year |
| Tennessee | $179.44 | $204.74 | +$25 | July |
| Texas | $170.24 | $251.09 | +$81 | July |
| Utah | $96.75 | $169.51 | +$73 | July |
| Vermont | $183.99 | $146.51 | -$37 | January |
| Virginia | $239.51 | $228.05 | -$11 | January |
| Washington | $175.32 | $125.89 | -$49 | January |
| West Virginia | $239.59 | $182.32 | -$57 | January |
| Wisconsin | $142.86 | $172.62 | +$30 | July |
| Wyoming | $143.03 | $130.77 | -$12 | January |
Average residential electric bill in January and July 2026, by state. "Higher month" says which month cost more in both 2026 and 2025 by at least $10; where the answer changed between the two years or the gap was under $10, it says "Depends on the year". Source: U.S. EIA, Form EIA-861M (2026 data preliminary).
These are statewide averages for all residential customers, not a forecast of your own bill. Your use depends on the size of your home, how it is heated and cooled and your utility's rate plan.
Which states have the biggest summer jump?
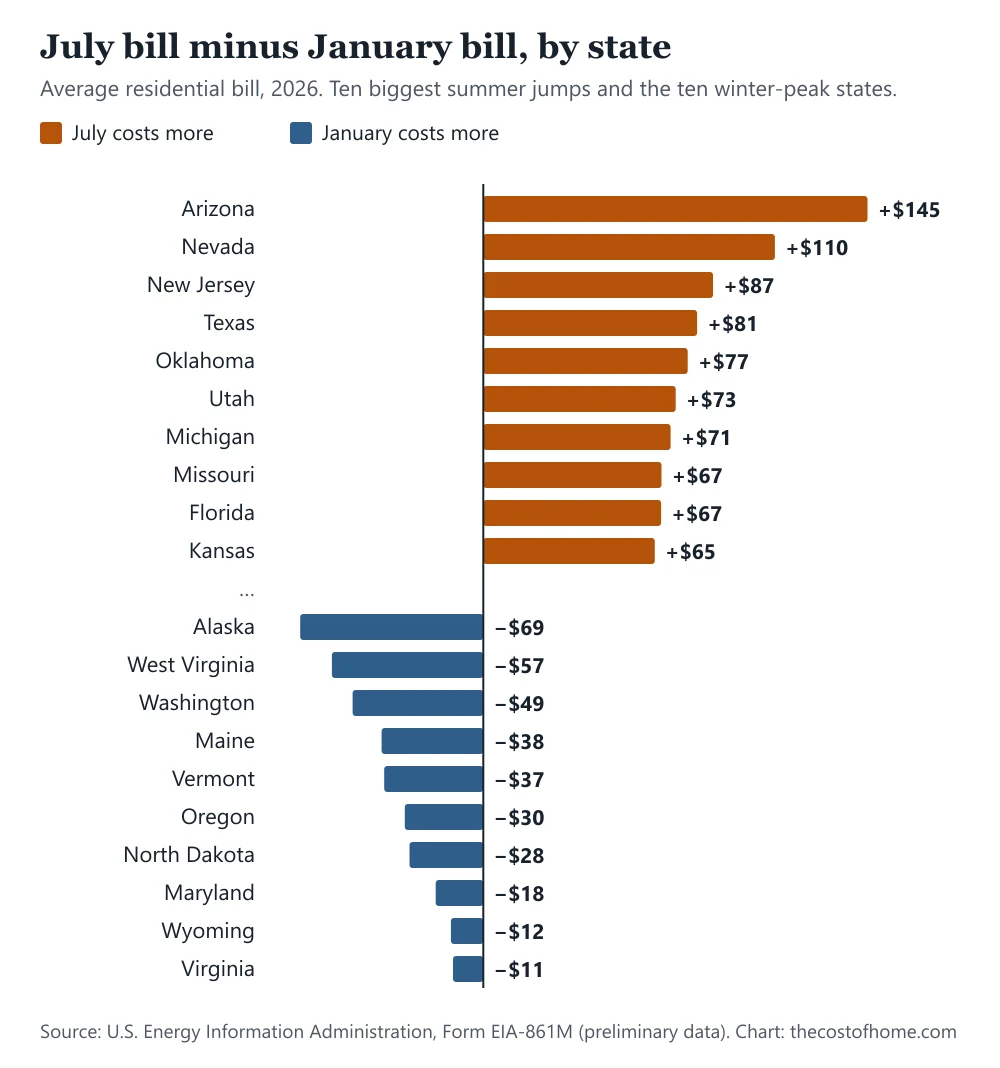
The five states where July cost the most above January in 2026 were:
- Arizona ($118 in January, $263 in July, 755 to 1,711 kWh)
- Nevada ($97 in January, $207 in July, 693 to 1,622 kWh)
- New Jersey ($174 in January, $261 in July, 753 to 1,036 kWh)
- Texas ($170 in January, $251 in July, 1,085 to 1,581 kWh)
- Oklahoma ($152 in January, $229 in July, 1,205 to 1,598 kWh)
In Arizona the bill rose 123%, from $118 to $263, and in Nevada 114%. Both followed the same two-year pattern: Arizona's gap was $129 in 2025 and $145 in 2026, Nevada's $74 and $110. The gap is use, not price. Arizona homes bought 755 kWh in January and 1,711 kWh in July, and the all-in price per kWh barely moved, from 15.6¢ to 15.4¢. Texas shows the same thing: 15.7¢ in January and 15.9¢ in July, with use up from 1,085 to 1,581 kWh.
Which states pay more for electricity in winter?
Ten states had a higher bill in January than in July in both 2025 and 2026, by at least $10 each time. The three with the biggest winter premium were:
- Alaska ($211 in January, $141 in July)
- West Virginia ($240 in January, $182 in July)
- Washington ($175 in January, $126 in July)
The rest are Maine, Vermont, Oregon, North Dakota, Maryland, Wyoming and Virginia. For about half of them the reason is easy to see in the EIA's 2020 Residential Energy Consumption Survey, which asks what fuel homes mainly heat with. Electricity is the main heating fuel in 55% of Washington homes, 50% in Virginia, 45% in Oregon, 45% in West Virginia, 41% in Maryland and 34% in North Dakota, against 34% for the country. When that many homes heat with electricity, the January bill carries the heating.
It is not the whole story. Only 13% of Alaska homes, 10% in Maine and 6% in Vermont mainly heat with electricity, yet their January bills are still higher. These data show the pattern, not the cause, but all three have cool summers, so July has little to add: Maine's average home bought 441 kWh in July against 590 kWh in January. If you are in this group, the winter heating forecast matters more to your budget than the summer one: see what the EIA expects winter 2026-27 heating to cost.
Which states have about the same bill in winter and summer?
13 states did not have a clear winner. Four of them have almost no gap in 2026: California (+$9), Delaware (+$5), Massachusetts (+$1), South Dakota (+$4). California's average home buys little electricity in both months (604 and 571 kWh, against 1,003 and 1,160 for the U.S.), so its bill barely moves with the seasons.
For the others, the answer changed with the year. 7 states, Connecticut, Hawaii, Idaho, Kentucky, North Carolina, Pennsylvania, South Dakota, had a higher July bill than January bill in one of the two years and the opposite in the other. Weather is the usual explanation: a hot July or a cold January pushes use up, and the EIA data do not separate it out. A single pair of months is a snapshot, so treat the labels for these states as "it depends", not as a rule.
How can you plan around the swing?
Start from your own bills, not the state average. Pull your January and July bills for the last two years, because one year of weather can mislead. Then:
- Find your peak month. If July is your high month, the air conditioner is the big lever; if January is, look at your heating, and at what a heat pump costs to run against a gas furnace if you heat with electricity.
- Measure the gap in kWh, not dollars. The price per kWh barely changes between January and July in most states, so the kWh difference tells you how much extra use you are paying for.
- Budget the peak, not the average. A bill that looks fine in April can double by July in Arizona, Nevada or Utah. Ask your utility whether it offers a budget or level-payment plan that spreads the cost across the year.
If summer is your expensive season, rooftop solar produces most when your bill peaks; our guide to what solar panels cost in 2026 covers the price and how much each state's sun gives you. The other large electric use in many homes, hot water, runs all year: see what a water heater costs to replace and run.
How was this calculated?
For each state and month, the EIA reports residential revenue, residential electricity sold and the number of residential customers. The average bill is revenue divided by customers; average use is kWh sold divided by customers; and the price per kWh is the bill divided by the use, which includes delivery charges and fees. The 51 figures for January and July 2026 are marked preliminary by the EIA and may be revised. Homes with net-metered rooftop solar buy less from the grid, so in states with a lot of residential solar, such as California and Hawaii, purchases understate the electricity homes actually use. Our full approach is in how we research costs, and more guides on household energy are in the Energy Bills section, including the average natural gas bill by state.
Frequently asked questions
Is the electric bill higher in winter or summer?
For the U.S. average, summer. The average residential bill was $175 in January 2026 and $212 in July, about $37 more. It depends on the state: July was clearly higher in 27 states and D.C., January in 10.
Which month has the highest electric bill?
Nationally, July. In the 12 months from August 2025 to July 2026, the U.S. average bill peaked at $212 in July 2026. In Arizona, Nevada, New Jersey, Texas and Oklahoma, July beat January by $77 or more.
Which states have a higher electric bill in winter?
Alaska, West Virginia, Washington, Maine, Vermont, Oregon, North Dakota, Maryland, Wyoming and Virginia had a higher January than July bill in both 2025 and 2026. In several of them, a large share of homes heat mainly with electricity.
How much does the electric bill go up in summer?
It depends on where you live. The U.S. average rose about 21% from January to July 2026, but Arizona's rose 123% ($118 to $263) and Nevada's 114%, while California's rose 5%.
Why is my electric bill so high in winter?
If your home heats with electricity, heating is the likely cause. Electricity is the main heating fuel in 55% of Washington homes and 50% of Virginia homes, according to the EIA's 2020 Residential Energy Consumption Survey. Compare your kWh with the same month last year to see whether use or price changed.
What is the cheapest month for electricity?
Nationally, the in-between months. The lowest U.S. averages in the past year were November 2025 ($125) and April 2026 ($128). In summer-peak states the low point is January; in winter-peak states it is July.
Sources

Founder and editor, The Cost of Home
I lived in the United States for five years, and this site grew out of the question every household there keeps asking: what will this cost, and is it worth it? Every number here comes from a public source listed at the end of the article.