Energy Bills
Are Data Centers Raising Your Electric Bill? What the Numbers Show
Quick answer
In part of the country, yes. In PJM, the grid operator for 13 states and Washington, D.C., data centers are the main reason capacity prices hit record highs, and the market monitor puts their added cost at $23.1 billion over three auctions. Nationally, Berkeley Lab found no sign that data center load changed price trends through 2025, and most of the rise has other causes.
On this page
Almost everyone who pays a power bill has now heard that data centers are making it bigger. Some of what you hear is backed by auction results and regulators' reports, and some is a number that was never about home bills at all. This guide separates the two, using public data: the EIA's prices, PJM's capacity auctions, the PJM market monitor, and a national study from Berkeley Lab. I mark what is confirmed, what is an estimate by a named group, and what nobody has settled.
The short version is that the answer depends on where you live. For what drives a bill inside your own house, see my guide to why your electric bill is so high.
How much have home electricity prices risen?
A lot, and for more than one reason. Using the EIA's monthly survey, the average U.S. residential price was 18.0 cents per kWh over the 12 months to August 2026, against 13.4 cents five years earlier. That is an increase of 34%. The number you see depends on the months you compare: January to January it is 38%, March to March 41% and August to August 31%, because winter prices were unusually low in early 2021. PolitiFact, citing EIA data in June, put the five-year rise at about 42%, which is above the range I get.
Berkeley Lab, which measures from 2019, finds that residential prices rose 33% from 2019 to 2025 in nominal terms, and 5.0% in 2025 alone. Adjusted for inflation, the 2019 to 2025 rise was 5.6% for homes. The lab also calculates that the average residential bill rose by about $480 a year over those six years, which is 2.5% of the total increase in what households spend. None of that tells you how much came from data centers. For that, you have to look at where the money moves.
What do PJM's capacity auctions show?
This is where the link between data centers and bills is clearest. PJM runs the grid for more than 67 million people in Delaware, Illinois, Indiana, Kentucky, Maryland, Michigan, New Jersey, North Carolina, Ohio, Pennsylvania, Tennessee, Virginia, West Virginia and Washington, D.C., all or in part. It holds an auction to pay power plants to be available years ahead, and the cost reaches the utilities that serve homes and businesses.
| Delivery year | Price | Added by data centers |
|---|---|---|
| 2025/2026 | $296.98 | $9.3 billion |
| 2026/2027 | $329.17 | $7.3 billion (82%) |
| 2027/2028 | $333.44 | $6.5 billion (66%) |
| 2028/2029 | $325.00 | Not yet estimated |
PJM capacity prices, in dollars per megawatt-day, and the market monitor's estimate of how much existing and forecast data center load added to capacity market revenue in each auction. The first three prices are weighted averages for the delivery year (June to May) across all auctions; the last is the 2028/2029 base auction price, which was the cap.
The last two auctions I read cleared at the price cap that regulators approved. For 2027/2028, PJM said the forecast peak load was about 5,250 MW higher than in the prior auction, and nearly 5,100 MW of that increase was data centers. PJM's executive for markets said the auction "leaves no doubt that data centers' demand for electricity continues to far outstrip new supply." In the 2028/2029 auction in July 2026, the price held at the $325 cap and the region was again short of its reliability target, by 6,831 MW.
PJM's independent market monitor, Monitoring Analytics, goes further. In its 2025 State of the Market report, it says data center load growth "is the primary reason for recent and expected capacity market conditions" and estimates that existing and forecast data centers added $23.1 billion to capacity market revenue across the 2025/2026, 2026/2027 and 2027/2028 auctions. It says that cost will be paid through May 2028. That is the monitor's estimate, a comparison against a world with no data center demand, not a bill.
It is also not the whole bill. PJM itself says capacity "accounts for a fraction of wholesale electricity costs," and that wholesale costs are only a portion of retail bills. PJM also notes that load hedged through self-supply or long-term contracts is not exposed to the auction price. That is one reason two states in the same grid can feel the same auction very differently.
Where did prices rise the most?
I compared the 15 states where data centers used the most electricity in 2023, according to the Electric Power Research Institute (EPRI), with what happened to home prices. The chart shows each state's data center share of its power and how much its residential price per kWh rose over five years.
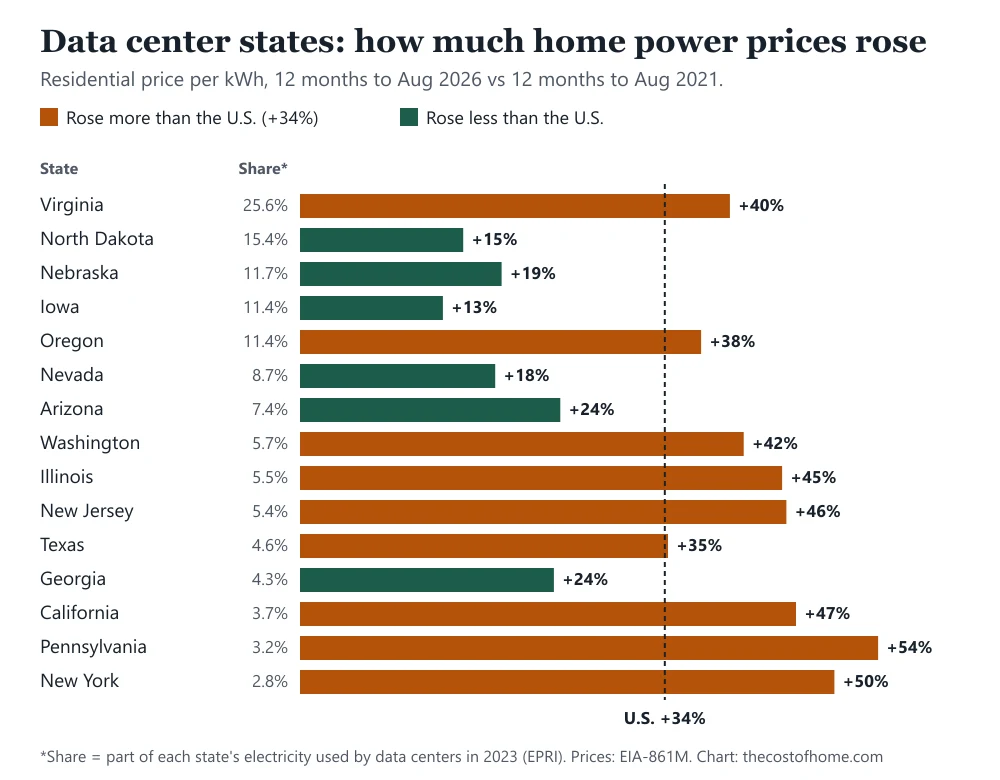
The pattern is not what the headlines suggest. Several states where data centers take a large share of the power saw smaller increases than the country as a whole: North Dakota (+15%), Nebraska (+19%), Iowa (+13%), Nevada (+18%), Arizona (+24%), Georgia (+24%). The biggest increases are in Pennsylvania (+54%), New York (+50%), California (+47%) and New Jersey (+46%), states where data centers are a small slice of demand. Virginia, with a quarter of its electricity going to data centers, sits above the average at +40%, and its price rose 12% in the last year alone.
That does not clear data centers, and it does not convict them. The share of power a state gives to data centers is not by itself what sets the price. Prices also follow how a state's grid is built, what it pays for fuel, and how much it spends on poles and wires. Berkeley Lab says transmission and distribution investment has been a significant driver of cost growth, and its list of other drivers includes storm and wildfire costs.
The one grouping where the gap is large is the one tied to the auctions above.
| Region | Aug 2021 | Aug 2025 | Aug 2026 | Since 2021 | Last year |
|---|---|---|---|---|---|
| PJM-heavy states | 13.2¢ | 17.6¢ | 19.6¢ | +49% | +11% |
| Rest of the U.S. | 13.5¢ | 16.8¢ | 17.8¢ | +32% | +6% |
| All states | 13.4¢ | 16.9¢ | 18.0¢ | +34% | +7% |
Average residential price per kWh for the states whose grid is mostly PJM (D.C., Delaware, Maryland, New Jersey, Ohio, Pennsylvania, Virginia and West Virginia) against the rest of the country, as 12-month averages to August of each year. Prices are revenue divided by kWh sold, from the EIA's monthly survey; 2026 data are preliminary.
States on PJM's grid saw prices rise 49% in five years against 32% elsewhere, and 11% in the last year against 6%. That is consistent with capacity costs reaching bills, which is the case Berkeley Lab uses PJM to illustrate. It is not proof that data centers caused all of the difference, and my grouping is rough: some of these states have only part of their territory in PJM, and some of the rise is delivery cost and fuel. In my opinion, it is the strongest evidence that data centers are a real part of the story, and the reason it is a regional story first.
What does the national research say?
The most careful national study I found is from Lawrence Berkeley National Laboratory, which compiles retail price data every year. Its July 2026 update finds that from 2019 to 2025 the states with the fastest growth in electricity use generally saw retail prices fall in real terms, by more than 1 cent per kWh in the highest-growth states, while states where use shrank often saw prices rise. The reason is that much of the cost of a grid is fixed, so more sales can spread it thinner. The lab says the presence of significant data center load does not appear to change that conclusion.
Two cautions are in the same report. For households alone the link is less clear, because growth that is mostly commercial and industrial does not necessarily lower residential rates. And the lab says past need not be prelude: it uses PJM as its example of how rapid growth in a constrained system can lift prices quickly, with data center load named as one of several causes, along with changes in how capacity is counted and the price cap. It estimates that data centers used about 4.4% of U.S. electricity in 2023 and could use 6.7% to 12% by 2028.
EPRI's 2026 update is higher. It projects data centers at 9% to 17% of U.S. electricity by 2030, up from 4% to 5% now, and says Virginia is the only state where they already use more than 20%. If those scenarios come true, what happened in PJM could be a preview for more of the country.
What is still unsettled?
Quite a lot, and politics is crowding the facts. A fact-check from PolitiFact in June rated a claim by Sen. Elizabeth Warren "Mostly False." She had said people living near large data centers have seen their bills rise as much as 267% in five years. PolitiFact found that the 267% came from a Bloomberg analysis of wholesale prices at certain points on the grid, not from residential bills, and that the wholesale supply component is about 30% to 50% of a typical bill. The same fact-check said data centers have been a major driver of price increases in some of the places where costs rose most.
Three questions remain open as of November 14, 2026:
- Who pays for the grid built for data centers. Berkeley Lab says large-load tariffs, which assign more of the cost to the big new customer, are one way to protect households, and utilities and regulators are still writing them.
- What PJM does about the shortfall. In July, PJM said it planned to ask federal regulators to approve a one-time backstop procurement of new supply and a "connect and manage" framework that would let data centers connect but operate flexibly when needed. The details have been changing, so check PJM's site. Its next base auction, for 2029/2030, is scheduled for December.
- How fast demand really grows. The forecasts differ by a factor of two, and PJM's forecasts already include data centers that have not been built.
What does this mean for your bill?
If you live in a PJM state, part of your supply charge is rising partly because of data center demand, and how much depends on how your utility buys power. If you are in a state with little data center demand, your increase probably comes from somewhere else. To see where your own state stands, my electricity prices by state guide has the price for every state, and the average electric bill by state turns it into dollars a month.
Then look at your own bill. My guide to reading your electric bill shows where the supply charge, the part that follows wholesale and capacity prices, sits on the page. If your utility's cheapest hours differ from its costliest, a time-of-use plan can reward you for moving a car charger or a dryer, and a smart thermostat can trim the biggest load. For where this sits in the budget of owning a house, see my guide to the monthly cost of owning a home.
How was this calculated?
Prices are the EIA's residential revenue divided by kWh sold in its monthly survey (EIA-861M), added up over 12 months so that high-use months count by their weight. I compared the 12 months from September 2025 to August 2026 (preliminary) with September 2020 to August 2021 (final), and for the last-year column with September 2024 to August 2025. The national figure includes all 50 states and D.C. The PJM-heavy group is D.C., Delaware, Maryland, New Jersey, Ohio, Pennsylvania, Virginia and West Virginia, which I chose because most or all of their grid is in PJM; other states have part of their territory in it.
The data center share of each state's electricity is EPRI's estimate for 2023, and the ranking is its list of the top 15 states by consumption. The auction prices and the "added by data centers" figures are PJM's and the market monitor's, not mine. Prices are nominal, meaning not adjusted for inflation; Berkeley Lab's inflation-adjusted figures are labeled as such. The comparison cannot isolate what data centers did, because prices also respond to fuel, weather, delivery spending and state policy.
Frequently asked questions
Are data centers raising electric bills?
In part of the country they are. In PJM's region, the market monitor attributes $23.1 billion of added capacity market revenue over three auctions to data center load, and home prices in states on that grid rose faster than elsewhere. Nationwide, Berkeley Lab's analysis through 2025 did not find data center load changing the overall price pattern.
How much have electricity prices gone up in five years?
Using the EIA's monthly survey, the average U.S. residential price rose 34%, from 13.4 to 18.0 cents per kWh, comparing the 12 months to August 2021 with the 12 months to August 2026. Comparing single winter months gives a bigger number, about 41% for March.
What is the PJM capacity auction?
It is an auction in which PJM pays power plants and other resources to be available to supply the grid in a future year. The cost reaches the utilities that serve homes and businesses in 13 states and Washington, D.C. Its last two auctions I read cleared at the price cap.
Was the claim that bills rose 267% near data centers true?
No. PolitiFact rated it "Mostly False" in June 2026, because the 267% came from wholesale prices at certain grid points in a Bloomberg analysis, not from residential bills. The wholesale supply component is about 30% to 50% of a typical bill.
Which states have the most data center electricity use?
Virginia is the highest by far: EPRI estimates data centers used about 25.6% of its electricity in 2023. North Dakota, Nebraska, Iowa and Oregon followed at 11% to 15%. By total use, Virginia, Texas, California, Illinois and Oregon led.
Will data centers make electricity more expensive in the future?
It is not settled. Berkeley Lab says load growth has tended to lower prices because it spreads fixed grid costs, but also that rapid growth in a constrained system can raise them quickly, as in PJM. EPRI projects data centers at 9% to 17% of U.S. electricity by 2030.
How can I tell if my utility is affected?
Check whether your utility buys power from PJM or another competitive market, then look at the supply charge on your bill. Your state regulator posts rate filings that explain increases. My guide to reading your electric bill shows where to find the supply charge.
Sources
- PJM Interconnection, news release "PJM Auction Procures 134,479 MW of Generation Resources," December 17, 2025: 2027/2028 Base Residual Auction results (accessed November 14, 2026)
- PJM Interconnection, news release "PJM Capacity Auction Procures 138,318 MW of Generation Resources," July 14, 2026: 2028/2029 Base Residual Auction results and next steps (accessed November 14, 2026)
- Monitoring Analytics, Independent Market Monitor for PJM, "2025 State of the Market Report for PJM, Volume 1: Introduction," March 12, 2026: data center impact on capacity market revenues and weighted average capacity prices (accessed November 14, 2026)
- Lawrence Berkeley National Laboratory, "Retail Electricity Price Trends and Drivers: Data Update, 2026 Edition, July update" (briefing slides, accessed November 14, 2026)
- PolitiFact, fact-check of Sen. Elizabeth Warren's claim about data centers and electricity bills, June 12, 2026, rated Mostly False (accessed November 14, 2026)
- U.S. Energy Information Administration, Form EIA-861M monthly sales and revenue by state, data through August 2026, preliminary (downloaded October 27, 2026)
- Electric Power Research Institute, "Powering Intelligence: Analyzing Artificial Intelligence and Data Center Energy Consumption," May 2024: state shares of electricity use in 2023 (accessed November 14, 2026)
- Electric Power Research Institute, summary brief of "Powering Intelligence: Updated Scenarios of U.S. Data Center Electricity Use and Power Strategies," 2026: 2030 scenarios (accessed November 14, 2026)

Founder and editor, The Cost of Home
I write and check every guide on this site myself, working from public data. The sources behind each number are listed at the end of the article, so you can check them too.