Home Repairs & Appliances
Gas vs Electric Stove: Which Costs Less to Run?
Quick answer
A gas stove is cheaper to run in almost every state. An average home pays about $32 a year to cook with natural gas and about $52 with electricity, at U.S. average prices. An induction top would be near $41. The gap is about $20 a year, small next to a heating bill. It shrinks to nothing in states with cheap electricity or dear gas, such as Arkansas and Florida.
On this page
- Is it cheaper to cook with gas or electricity?
- How do you work out the cost for your own stove?
- How much does it cost to cook with gas or electricity in your state?
- Is an induction stove cheaper to run than gas?
- What does the monthly cost leave out?
- How can you cut what the stove costs?
- What does a year of cooking cost in all 50 states?
- How was this calculated?
- FAQ
- Sources
Cooking is one of the smaller lines on a household energy bill, so the gas-or-electric question is not worth much money. It is still worth getting right, because it comes up when you replace a range, buy a house or hear that induction is the efficient choice. The answer depends on two prices on your bills: what a kilowatt-hour (kWh) of electricity costs and what a therm of natural gas costs. A therm is 100,000 Btu.
Below I use the U.S. Energy Information Administration's (EIA) survey of how much energy homes really use to cook, put today's prices on it, and show the result for each state. The prices are the ones from my electricity prices by state and natural gas bill by state guides, the same I used for the dryer.
Is it cheaper to cook with gas or electricity?
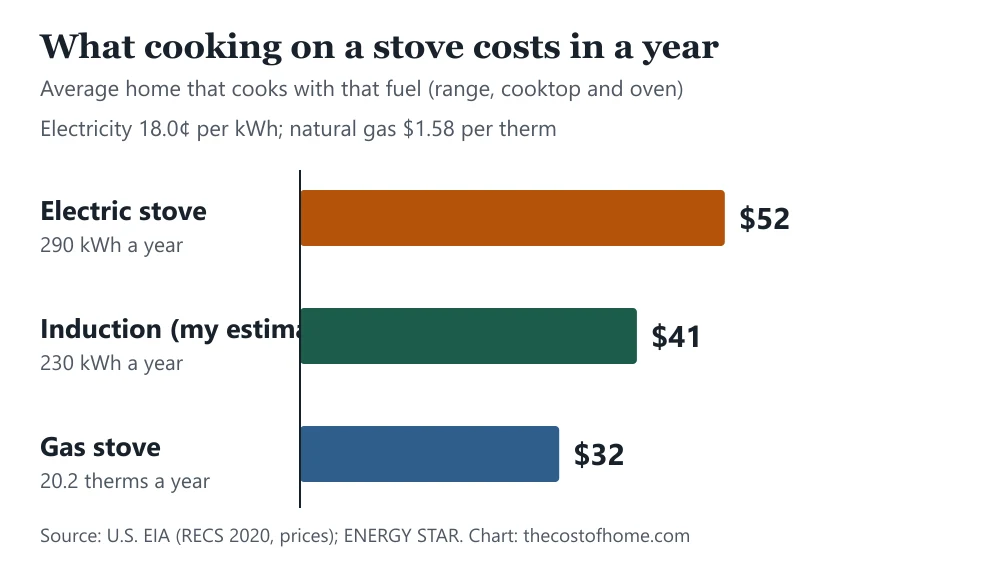
At U.S. average prices, gas. The EIA's 2020 Residential Energy Consumption Survey (RECS) found that a home that cooks with natural gas burned about 2.02 million Btu a year on its range, cooktop and oven, which is 20.2 therms. At $1.58 a therm that is $32. A home that cooks with electricity used about 290 kWh, which at 18.0 cents is $52. The two stoves differ by about $20 a year, or $1.70 a month.
| Stove | Energy a year | Per year | Per month |
|---|---|---|---|
| Gas | 20.2 therms | $32 | $2.65 |
| Electric | 290 kWh | $52 | $4.35 |
| Induction | 230 kWh | $41 | $3.45 |
What the average home that cooks with each fuel pays a year, at U.S. average prices (18.0 cents per kWh and $1.58 per therm). The electric and gas figures come from the EIA's 2020 survey of homes. The induction line is my estimate for the same cooking done on an induction top, not a measured average.
The survey is from 2020, so I checked the result against what homes were billed then: the EIA's same survey put the average natural gas spending on cooking at $30 a year. My $32 for 2026 is close, which is a good sign that the gas math holds. Gas wins on price even though the electric stove uses less energy, because a unit of energy from gas is much cheaper than a unit from the grid. One kWh is 3,412 Btu, and a therm (100,000 Btu) costs $1.58 against $5.27 for the same Btu as electricity.
How do you work out the cost for your own stove?
Use the same two lines I used. For an electric stove, kWh a year times your price per kWh. For a gas stove, therms a year times your price per therm. The kWh and therms on your own bill are the best guide, but you can start from the EIA's averages: 290 kWh for electric, 20.2 therms for gas.
The averages describe a home that cooks about like the typical one. The EIA says that among homes that cook a hot meal at home, the cooktop is used an average of 8 times a week and the oven 3 times. If you cook twice as much, double the figures; if you eat out half the week, halve them. A typical week of cooking costs about $1.00 on electric and $0.61 on gas, so even a holiday week with four times the usual cooking adds only about $3 on electric and $2 on gas. That is my arithmetic, not a measured figure.
How much does it cost to cook with gas or electricity in your state?
Gas is cheaper in 49 of the 51 places on my list, which are the 50 states and the District of Columbia. The gap is widest where electricity is dear and gas is cheap: California pays $96 a year to cook with electricity and $43 with gas, a difference of $53, and Alaska is next at $51. Electric cooking runs from $36 a year in North Dakota to $126 in Hawaii; gas runs from $16 in Idaho to $102 in Hawaii.
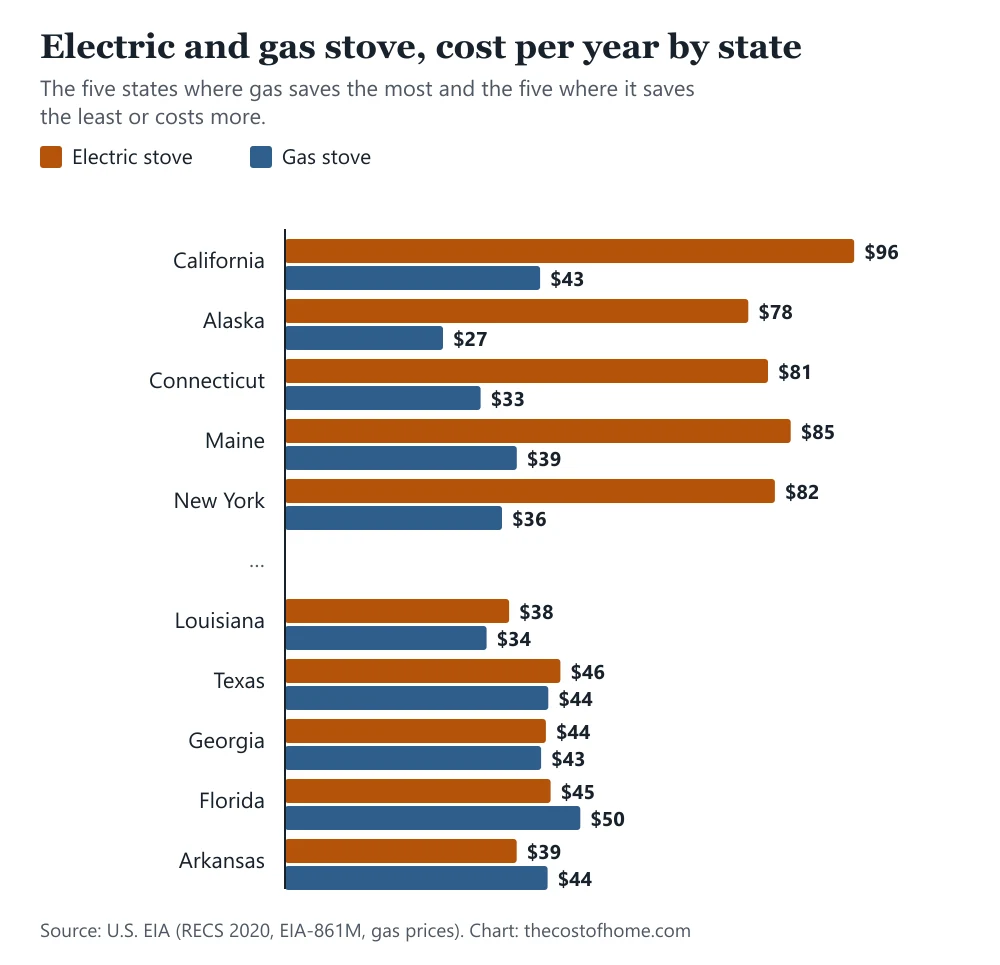
In 2 places gas actually costs more: Arkansas ($5 more) and Florida ($5 more). In 2 more, Georgia and Texas, the two are within $3 a year. Find your state in the full table at the end of this guide, and if your bills show a different price, use yours in the formulas above.
Is an induction stove cheaper to run than gas?
It can be, in some states. ENERGY STAR, citing a 2019 Frontier Energy study, says an induction top sends about 85% of its energy into the cookware, against about a third for gas, and that it can boil water in nearly half the time. An induction top heats iron and steel pots directly with a magnetic field, so most of the energy ends up in the food and less in the kitchen air.
I turned that into a cost. If the same cooking that takes 20.2 therms of gas were done on induction, it would need about 230 kWh (20.2 therms × 29.3 kWh a therm × one third ÷ 0.85). At 18.0 cents a kWh that is about $41 a year, which is $11 less than the average electric stove and $10 more than gas. It beats gas in 11 of the 51 places on my list, where electricity is cheap or gas is dear, such as Arkansas, Arizona, Florida and Georgia. This is a rough estimate. It treats the oven like a cooktop, and real homes vary, so use it to compare, not to budget.
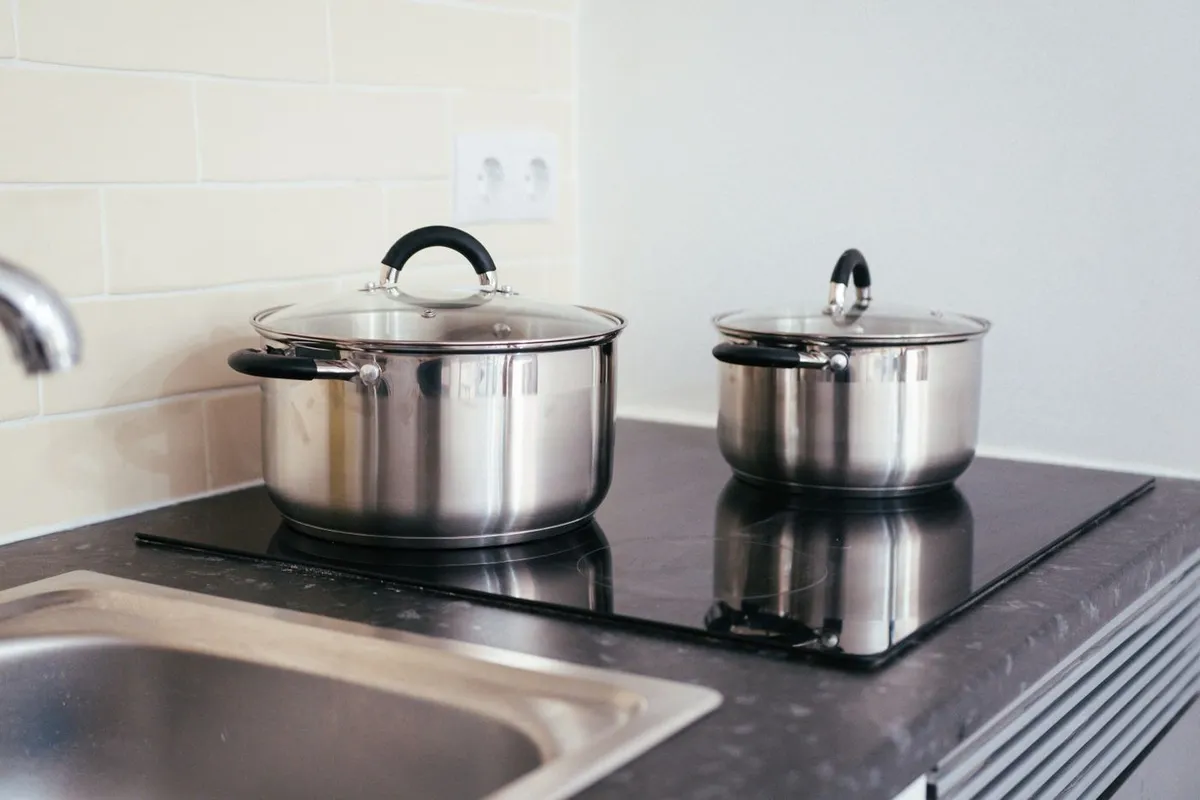
ENERGY STAR also certifies electric cooktops and ranges that use no more than 195 kWh a year in its test, which assumes about 8 cooking events a week. Its list does not include gas models, so I did not use it to compare fuels. If you are buying electric, the label is a quick way to rule out the thirstiest models.
What does the monthly cost leave out?
Quite a lot, and most of it matters more than the $20 a year. The running cost says nothing about the price of the stove itself, and it leaves out the cost of getting gas to the kitchen if there is no gas line. If you heat with propane instead of natural gas, the fuel costs more per unit; my propane versus natural gas guide shows how much. And a different stove changes the cost of the cookware, since induction needs pots that a magnet sticks to.
The standards may change too. The Department of Energy (DOE) lists a final rule from 2024 for gas and electric ranges, cooktops and ovens, with compliance set for January 31, 2028, and also lists May 2025 proposals to rescind its newer design requirements for them. I would not wait on that when you choose a stove: it will not move your cooking bill by more than a few dollars either way.
In my opinion, with a difference this small, the better question is what you already have. If your kitchen has a gas line and you like to cook on a flame, keeping gas saves money in most states. If you are replacing a gas range with an electric one to avoid the line, you will spend a few dollars more a year, and you pay for the comfort of a flat top. If the stove is broken, my repair or replace guide covers when repair still makes sense.
How can you cut what the stove costs?
- Check your own prices. Both are on your bills, and they move the result more than the stove model. My guide on how to read your electric bill shows where to find the kWh price.
- Use a lid and the right burner size. A pot on a burner that is too big sends heat past the pot; a lid keeps what the pot has.
- Use the oven less when you can. The EIA's average counts the oven too, so the oven is part of the number. A toaster oven or microwave can handle small jobs, and my air fryer versus oven guide shows when an air fryer costs less than heating the full oven.
- Turn it off early. Cooktops and ovens stay hot for a few minutes after you switch them off, so you can finish a dish on the leftover heat.
- Look at the bigger lines first. Cooking is small next to heating, cooling and the water heater. My electric bill guide shows where the larger costs sit.
For more on what appliances cost to run, see my guides on the refrigerator and the clothes dryer, and the Home Repairs & Appliances section.
What does a year of cooking cost in all 50 states?
Here is the full list for the 50 states and the District of Columbia. Every row uses the same 290 kWh and 20.2 therms, so the only thing that changes is the price of the fuel. The figures are arithmetic for an average home that cooks with that fuel, not what residents actually pay.
| State | Electric | Gas | Gas saves |
|---|---|---|---|
| U.S. average | $52 | $32 | $20 |
| Alabama | $48 | $36 | $12 |
| Alaska | $78 | $27 | $51 |
| Arizona | $45 | $39 | $5 |
| Arkansas | $39 | $44 | −$5 |
| California* | $96 | $43 | $53 |
| Colorado | $48 | $23 | $25 |
| Connecticut* | $81 | $33 | $48 |
| Delaware | $52 | $36 | $16 |
| District of Columbia | $70 | $34 | $36 |
| Florida* | $45 | $50 | −$5 |
| Georgia | $44 | $43 | $1 |
| Hawaii* | $126 | $102 | $24 |
| Idaho | $37 | $16 | $21 |
| Illinois | $54 | $23 | $31 |
| Indiana | $49 | $24 | $25 |
| Iowa | $41 | $23 | $18 |
| Kansas* | $44 | $29 | $15 |
| Kentucky | $40 | $32 | $8 |
| Louisiana* | $38 | $34 | $4 |
| Maine* | $85 | $39 | $46 |
| Maryland* | $61 | $33 | $28 |
| Massachusetts | $88 | $51 | $37 |
| Michigan | $61 | $22 | $39 |
| Minnesota | $47 | $22 | $25 |
| Mississippi | $43 | $34 | $9 |
| Missouri | $40 | $33 | $7 |
| Montana | $40 | $18 | $22 |
| Nebraska | $37 | $25 | $12 |
| Nevada | $39 | $22 | $17 |
| New Hampshire* | $77 | $36 | $41 |
| New Jersey | $69 | $29 | $40 |
| New Mexico* | $44 | $19 | $25 |
| New York | $82 | $36 | $46 |
| North Carolina* | $43 | $36 | $7 |
| North Dakota | $36 | $20 | $16 |
| Ohio* | $53 | $27 | $26 |
| Oklahoma* | $40 | $28 | $12 |
| Oregon | $45 | $34 | $11 |
| Pennsylvania | $60 | $31 | $29 |
| Rhode Island* | $85 | $42 | $43 |
| South Carolina* | $45 | $33 | $12 |
| South Dakota | $41 | $21 | $20 |
| Tennessee | $39 | $26 | $13 |
| Texas | $46 | $44 | $2 |
| Utah | $39 | $22 | $17 |
| Vermont | $69 | $36 | $33 |
| Virginia | $48 | $35 | $13 |
| Washington* | $41 | $34 | $7 |
| West Virginia* | $45 | $27 | $18 |
| Wisconsin* | $54 | $21 | $33 |
| Wyoming | $41 | $25 | $15 |
What an average year of cooking costs on an electric and on a gas stove in each state, from 290 kWh of electricity or 20.2 therms of natural gas at the state's average residential price (electricity: September 2025 to August 2026, preliminary; gas: 12 months to July 2026). A minus sign in the last column means gas costs more. Places marked * use the 2025 gas price because the monthly series is incomplete.
How was this calculated?
The yearly energy use comes from the EIA's 2020 Residential Energy Consumption Survey: 290 kWh for the average home that cooks with electricity (tables CE5.1 and CE5.3, the same I used for my dryer guide) and 2.02 million Btu, or 20.2 therms, for the average home that cooks with natural gas (table CE5.4). Both cover the range, cooktop and oven and leave out microwaves, small appliances and outdoor grills. The 2020 survey is the latest one that publishes this detail.
The electricity price for each state is residential revenue divided by kWh sold, from the EIA's Form EIA-861M (preliminary) for September 2025 to August 2026: 18.0 cents for the U.S. The natural gas price is the EIA's residential price per 1,000 cubic feet for August 2025 to July 2026, converted at 1,037 Btu per cubic foot to $1.58 per therm. In 18 places the monthly gas series is incomplete, and I used the 2025 yearly price instead; those rows carry an asterisk. The induction figure is my own estimate from ENERGY STAR's efficiency numbers, as shown above, and I did not use the ENERGY STAR list of models for cost because its test covers cooktops alone. The share of homes that cook with gas (38%) and the cooking frequency come from the EIA's Today in Energy note on cooking. My sources and method are set out in how I research costs.
Frequently asked questions
Is a gas or electric stove cheaper to run?
A gas stove, in most states. At U.S. average prices an average home pays about $32 a year to cook with natural gas and about $52 with electricity, a gap of $20. Gas is cheaper in 49 of 51 places on my list, including D.C.
How much does it cost to run an electric stove per month?
About $4.35 a month for the average home that cooks with electricity, which is 290 kWh a year at the U.S. average of 18.0 cents per kWh. It is about $3 a month in North Dakota and about $11 in Hawaii.
How much does it cost to run a gas stove per month?
About $2.65 a month for the average home that cooks with natural gas, which is 20.2 therms a year at the U.S. average of $1.58 per therm. Your own price per therm is on your gas bill.
Is an induction stove cheaper than gas?
Sometimes. ENERGY STAR says induction sends about 85% of its energy into the cookware against about a third for gas. By my estimate that is about $41 a year against $32 for gas at U.S. average prices, so gas is still cheaper on average, but induction wins in 11 of 51 places where electricity is cheap or gas is dear.
How do I know if gas is cheaper where I live?
Divide your price per therm by your price per kWh. If the answer is under about 14, gas is cheaper for an average home. The national figure is 8.8. Both prices are on your bills.
What share of U.S. homes cook with gas?
About 38% of U.S. households cook with natural gas, according to the EIA's 2020 survey. Electricity is the most common cooking fuel. California (70%) and New Jersey (69%) have the highest shares of gas cooking.
Is a gas stove cheaper if I use propane?
Not necessarily. Propane usually costs more per unit of energy than natural gas, so a propane stove can cost as much as an electric one or more. Work it out with your own propane price per gallon and compare it with your electricity price.
Sources
- U.S. Energy Information Administration, Residential Energy Consumption Survey 2020, Table CE5.4: natural gas and propane end-use consumption, cooking (accessed November 10, 2026)
- U.S. Energy Information Administration, Residential Energy Consumption Survey 2020, Table CE5.8: natural gas and propane end-use expenditures (accessed November 10, 2026)
- U.S. Energy Information Administration, Residential Energy Consumption Survey 2020: electricity end-use tables CE5.1 and CE5.3 (used in my dryer and refrigerator guides)
- U.S. Energy Information Administration, Today in Energy: cooking in U.S. homes, from the 2020 RECS (accessed November 10, 2026)
- U.S. Energy Information Administration, Form EIA-861M: monthly sales, revenue and customers by state (September 2025 to August 2026, preliminary)
- U.S. Energy Information Administration, Natural Gas Prices: residential price (August 2025 to July 2026)
- ENERGY STAR, electric cooking products: induction efficiency (citing Frontier Energy, July 2019) and buying guidance (accessed November 10, 2026)
- U.S. Department of Energy, Consumer Conventional Cooking Products: standards and rulemaking status (accessed November 10, 2026)

Founder and editor, The Cost of Home
I write and check every guide on this site myself, working from public data. The sources behind each number are listed at the end of the article, so you can check them too.